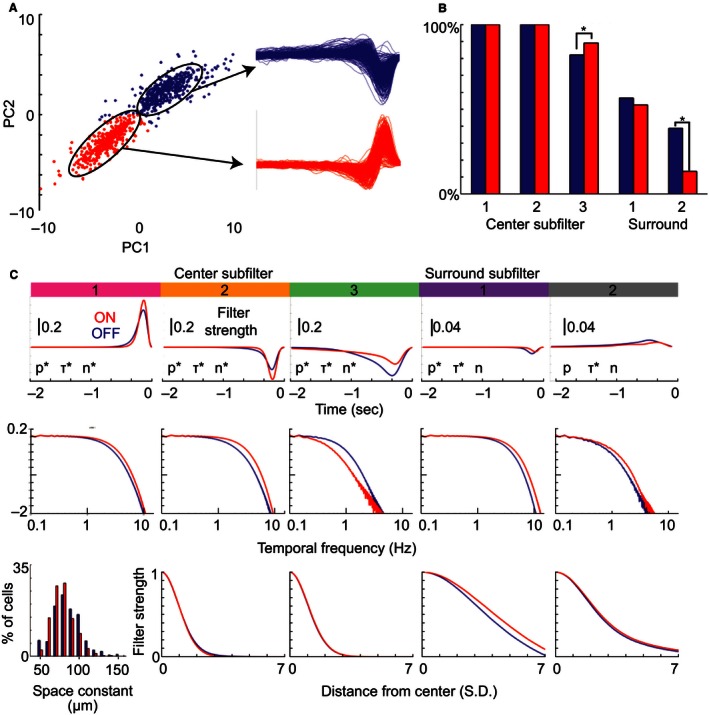
Figure 5.

Subfilter properties differ significantly between ON‐ and OFF‐dominated cells. (A) Cells are plotted relative to the first (PC1) and second principal components (PC2) of the temporal STAs at their spatial peak. Two clusters were apparent, the blue group corresponded to OFF‐dominated cells and the red to ON‐dominated cells. (B) Comparison of subfilter observation rates between OFF‐ (blue) and ON‐dominated cells (red). (C) For each subfilter type (columns) we compare the temporal impulse responses (top row), frequency tuning (middle row), and spatial profiles (bottom row) of ON‐ and OFF‐dominated cells. As the first subfilter was constrained to match the original temporal fit, its spatial profile (bottom left) is substituted with the distribution of radial space constants. The asterisk next to p, τ, and n indicates those properties differed significantly between ON‐ and OFF‐dominated cells (P < 0.01, t‐test with post hoc correction).
