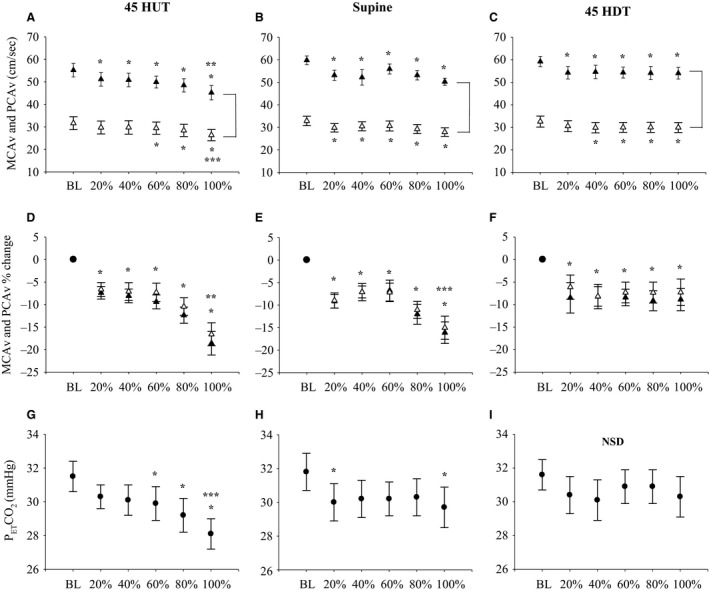
Figure 2.

Absolute and relative MCAv and PCAv responses to LBNP in each body position. (▲) represents MCAv data, (∆) represents PCAv data, (•) represents PETCO 2. Absolute MCAv and PCAv during baseline (BL) and at 20%, 40%, 60%, 80%, and 100% of the LBNP protocol in 45°HUT (Panel A), supine (Panel B), and 45°HDT (Panel C) positions. Relative MCAv and PCAv during BL and at 20%, 40%, 60%, 80%, and 100% of the LBNP protocol in 45°HUT (Panel D), supine (Panel E), and 45°HDT (Panel F) positions. PETCO 2 during BL and at 20%, 40%, 60%, 80%, and 100% of the LBNP protocol in 45°HUT (Panel G), supine (Panel H), and 45°HDT (Panel I) positions. Mean data ± SEM is represented at each data point. No statistical comparisons between BL and percent of LBNP protocol are shown in the figure, these comparisons can be found in Table 2. Brackets between MCAv and PCAv data represents main effect (P < 0.05) between the two vessels. *P < 0.05, between baseline and percent of the LBNP protocol. **P < 0.05, between 100% of LBNP protocol and 20%, 40%, 60% of LBNP protocol. ***P < 0.05, between 100% of LBNP protocol and 40%, and 60% of LBNP protocol. NSD, no significant differences detected; HUT, head‐up tilt; LBNP, lower body negative pressure; PCA, posterior cerebral artery.
