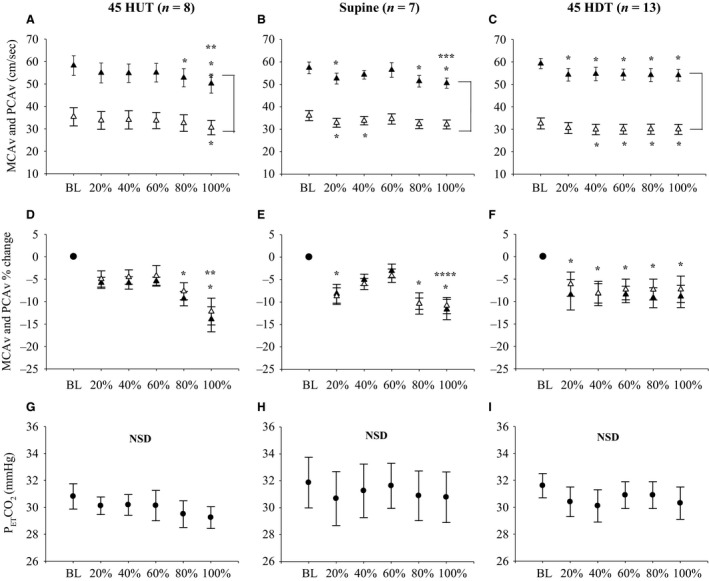
Figure 3.

Absolute MCAv and PCAv responses to LBNP in each body position when PETCO 2 was appropriately controlled. (▲) represents MCAv data, (∆) represents PCAv data, (•) represents PETCO 2. Absolute MCAv and PCAv during baseline (BL) and at 20%, 40%, 60%, 80%, and 100% of LBNP protocol in 45°HUT (n = 8; Panel A), supine (n = 7; Panel B), and 45°HDT (n = 13; Panel C). Relative MCAv and PCAv during BL and at 20%, 40%, 60%, 80%, and 100% of LBNP protocol in 45°HUT (n = 8; Panel D), supine (n = 7; Panel E), and 45°HDT (n = 13; Panel F). PETCO 2 during BL and at 20%, 40%, 60%, 80%, and 100% of LBNP protocol in 45°HUT (n = 8; Panel G), supine (n = 7; Panel H), and 45° HDT (n = 13; Panel I). Mean data ± SEM is represented at each data point. Brackets between MCAv and PCAv data represent main effect (P < 0.05) between the two vessels. *P < 0.05, between baseline and percent of LBNP protocol. **P < 0.05, between 100% of LBNP protocol and 20%, 40%, 60% of LBNP protocol. ***P < 0.05, between 100% of LBNP protocol and 40%, and 60% of LBNP protocol. ****P < 0.05, between 100% of LBNP protocol and 60% of LBNP protocol. NSD, no significant differences detected; LBNP, lower body negative pressure; PCA, posterior cerebral artery.
