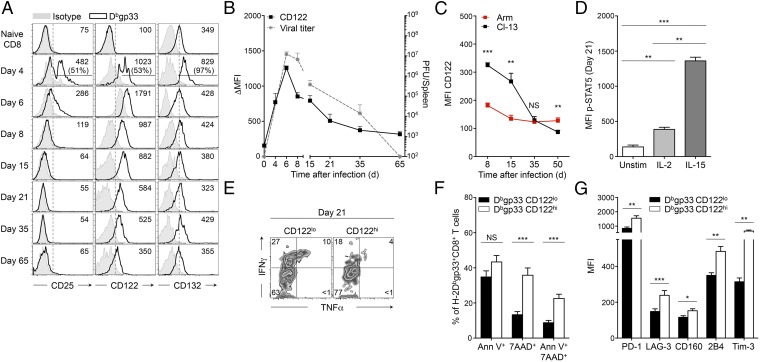
Fig. 1.
CD122 expression is maintained on CD8+ T cells and identifies severely exhausted cells. C57BL/6 (B6) mice were infected with LCMV Cl-13; analyses were performed in spleens on LCMV-specific H-2Dbgp33+CD8+ T cells at day 21 p.i., unless otherwise indicated. (A) Cell-surface expression of CD25, CD122, and CD132 at distinct time points after infection. Values in quadrants indicate MFI (and frequency of highly positive cells on Day 4); gray-filled histograms are isotype controls. (B) Cell-surface expression of CD122 [left y axis; filled squares represent Δ MFI (MFI minus isotype control MFI)] and viral titers (right y axis; dotted gray line) at indicated time points. (C) Cell-surface expression of CD122 on H-2Dbgp33+CD8+ T cells isolated at indicated time points from mice infected with LCMV Arm (acute infection; red squares) or LCMV Cl-13 (chronic infection; black squares). (D) Intracellular expression of p-STAT5 in activated (CD11a+) CD8+ T cells following stimulation with the indicated cytokines. Unstim, unstimulated control. (E) Intracellular production of IFNγ and TNFα in CD122lo H-2Dbgp33+CD8+ T cells (Left) and CD122hi H-2Dbgp33+CD8+ T cells (Right). Values indicate the frequency of cells in each quadrant. (F) Frequency of CD122lo H-2Dbgp33+CD8+ T cells (black bars) and CD122hi H-2Dbgp33+CD8+ T cells (white bars) positive for Annexin V and/or 7AAD. (G) Expression of the indicated inhibitory receptors on CD122lo H-2Dbgp33+CD8+ T cells (black bars) and CD122hi H-2Dbgp33+CD8+ T cells (white bars). Bars represent the MFI. *P < 0.05; **P < 0.005; ***P < 0.0005; NS P ≥ 0.05 (two-tailed unpaired Student’s t test). Data are pooled from two (C and G) or three (B and F) independent experiments with at least five mice per group or are representative of three independent experiments (A, D, and E) with similar results (n = 2 or 3 mice per group in each). Error bars in B–D, F, and G indicate mean ± SEM.

