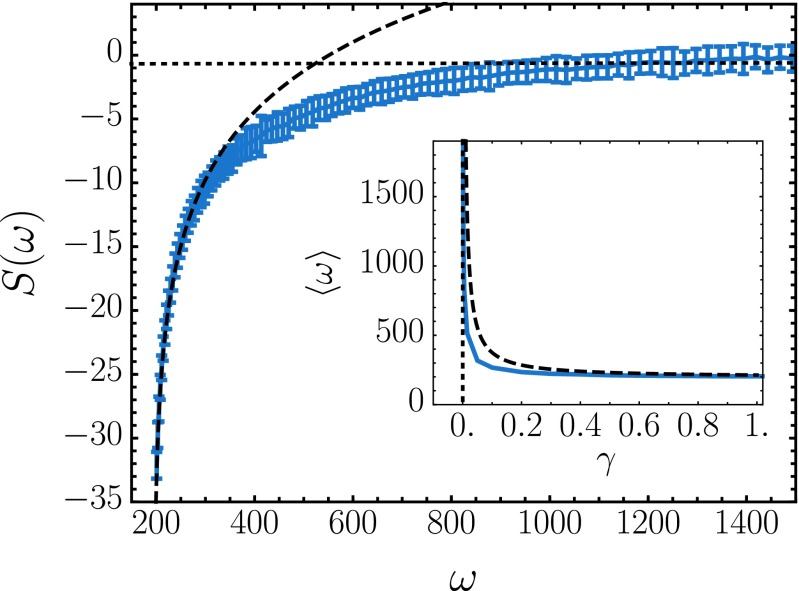
Fig. 2.
Protocol entropy quantifies the diversity of protocols with average dissipation ω. By sampling the distribution equation (Eq. 5) with Monte Carlo sweeps and using various biasing strengths γ, the protocol entropy was computed using the MBAR method (43). The slope of the protocol entropy at gives the strength of the bias necessary to yield mean dissipation . Asymptotic limits for small and large γ are plotted as the dotted and dashed lines, respectively. (Inset) The average dissipation for protocols as a function of the bias γ. Note that a small bias produces most of the achievable dissipation reduction.

