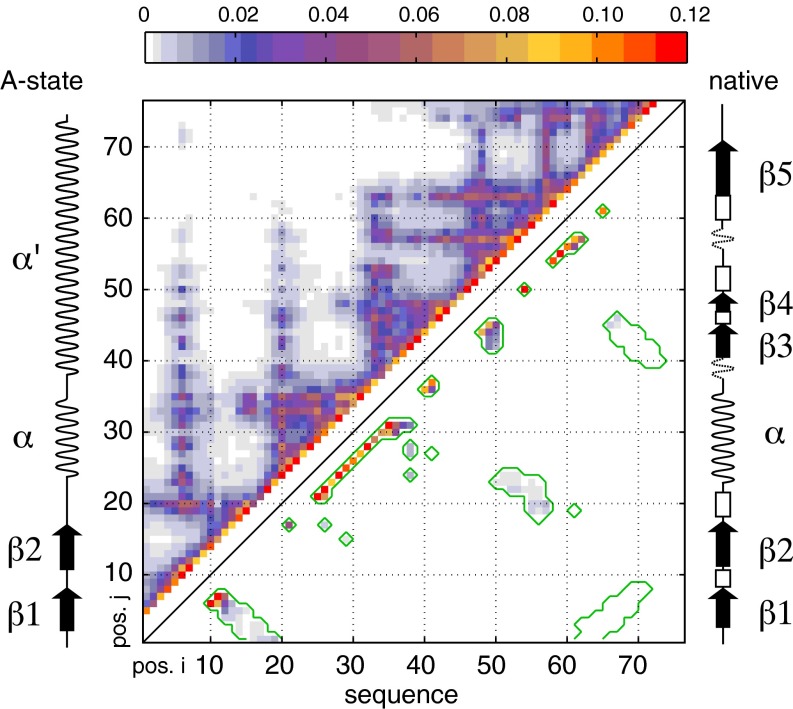
Fig. 1.
Cα–Cα contact map of urea-denatured ubiquitin. Four hundred low-energy structural ensembles of 20 conformers each were generated as described in Methods using X-PLOR simulations with restraints derived from RDC, PRE, J-coupling, and SAXS data. Contact probabilities p(i,j) between residue i and residue j were determined as the total number of contacts observed in all conformers with Cα–Cα distances smaller than 8 Å divided by the total number of conformers (i.e., 8,000). The contact probabilities p(i,j) are color-coded as indicated by the color bar at the top and plotted versus sequence positions i and j. The upper left part of the contact map represents all observed contacts; the lower right part shows only contacts also present in the native state of ubiquitin (delimited by green contour lines). Merely for comparison, the secondary structures of native state and A-state ubiquitin are shown schematically at the right and left sides, respectively.

