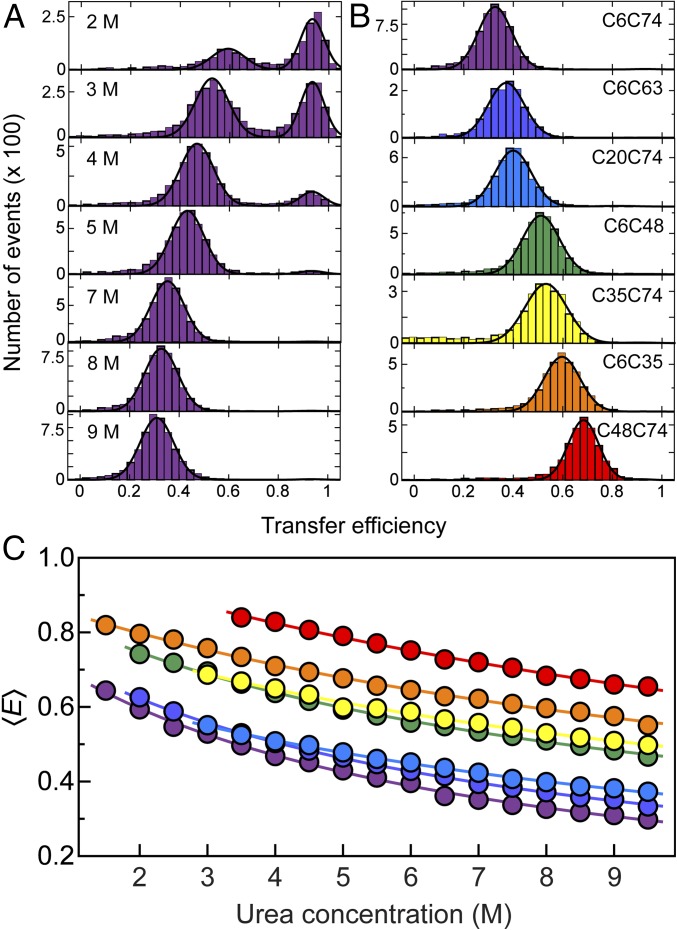
Fig. 2.
(A) Single-molecule FRET efficiency (E) histograms of the C6C74 variant of ubiquitin at different concentrations of urea, pH 2.5, illustrating the unfolding transition and the unfolded-state expansion. The peak at E ≈ 0.9 corresponds to folded and the peak at lower E to unfolded molecules. To determine mean transfer efficiencies, 〈E〉, peaks were fitted with Gaussian peak functions (black lines). (B) Histograms at 8 M urea, pH 2.5 for all ubiquitin variants investigated, with the positions of labeled Cys residues indicated for each panel. The color code is the same as in Table 1. (C) Dependencies of mean transfer efficiencies of the unfolded subpopulation on the urea concentration for all variants (color code as in B). The solid lines are fits with a weak binding model (43, 74) of the form E(cD) = E0 + ΔE KcD/(1 + KcD) for interpolation, where cD is the denaturant concentration, and K, ΔE, and E0 are fit parameters.

