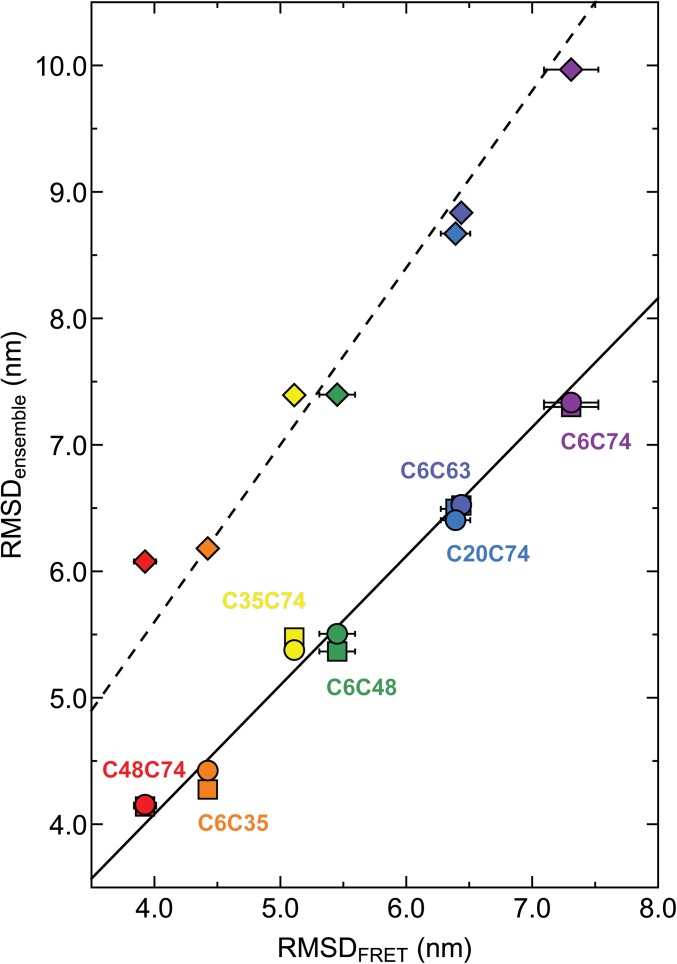
Fig. 4.
RMSDs obtained from ensemble calculations versus RMSDs obtained from single-molecule FRET measurements (the average values of RMSDs calculated from mean transfer efficiencies and fluorescence lifetime distribution analysis are corrected for dye linker lengths). Ensemble calculations were carried out with NMR and SAXS restraints (circles), only SAXS restraints (squares), or without any experimental restraints (diamonds), respectively. Color-coding corresponds to respective ubiquitin mutants in Table 1 and Fig. 2. The lines represent least-squares fits to the data of the form RMSDensemble = m·RMSDFRET, with m = 1.02 (NMR+SAXS, solid line), 1.02 (SAXS, solid line), 1.40 (no restraints, dashed line).

