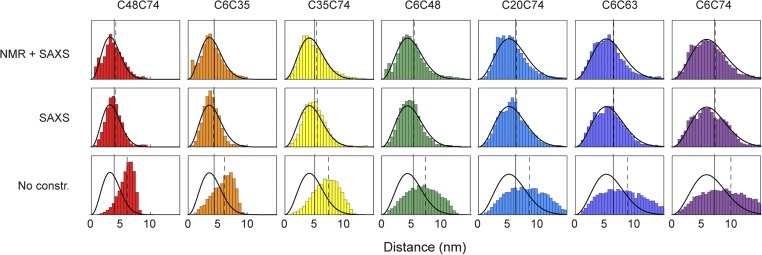
Fig. 5.
Comparison of Cα–Cα distance distributions derived from restrained ensemble calculations and single-molecule FRET. Bars show Cα–Cα distance distributions from the molecular ensembles calculated under different types of experimental restraints: NMR+SAXS, SAXS, and without experimental constraints (No constr.) (color-coded as in Table 1). Solid black lines depict the distance distributions as obtained from single-molecule FRET measurements for each ubiquitin variant. The vertical black solid and dashed lines indicate the values of RMSDs from FRET measurements and ensemble calculations, respectively.

