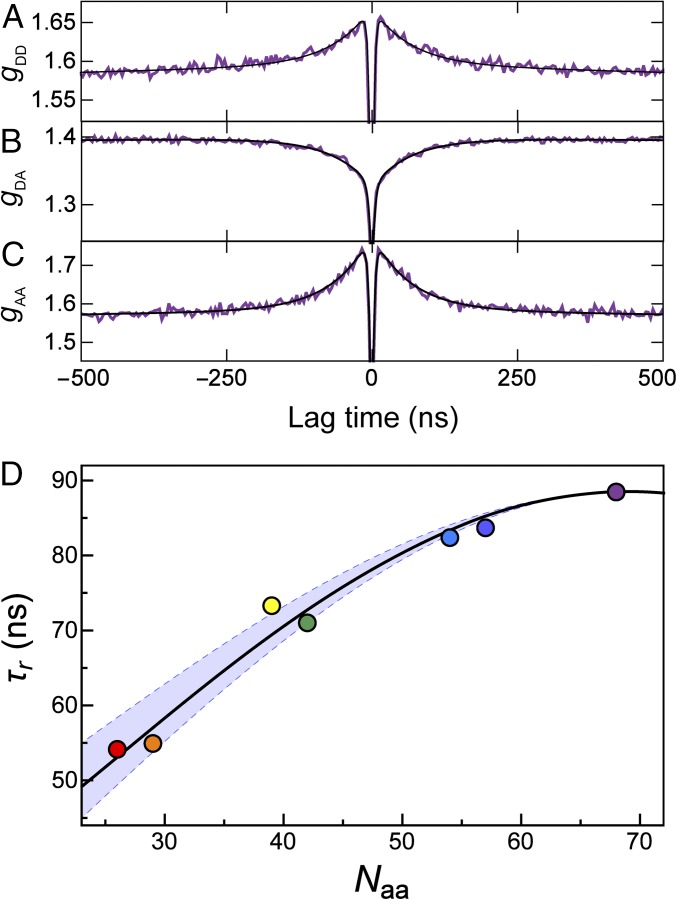
Fig. 6.
(A–C) nsFCS measurements of the donor–acceptor distance dynamics for the C6C74 ubiquitin variant at 8 M urea. The global fit of donor–donor (A), donor–acceptor (B), and acceptor–acceptor (C) correlations is used to determine the reconfiguration time, τr, of the unfolded chain. (D) The resulting reconfiguration times for all variants as a function of sequence separation show distance dynamics of the unfolded chain in the range of 50–90 ns. The black line represents the fit with a modified RIF model, resulting in an internal friction time of τi = 25 ns (see Methods for details). The lower and upper bounds of the light blue band are determined by the same fit with internal friction times τi = 10 ns and τi = 40 ns, respectively. The color code for the variants is the same as in Table 1. Note that the rapid drop in the correlation functions in the low nanosecond range is caused by photon antibunching on the timescale of the excited state lifetime (93) and not related to chain dynamics.

