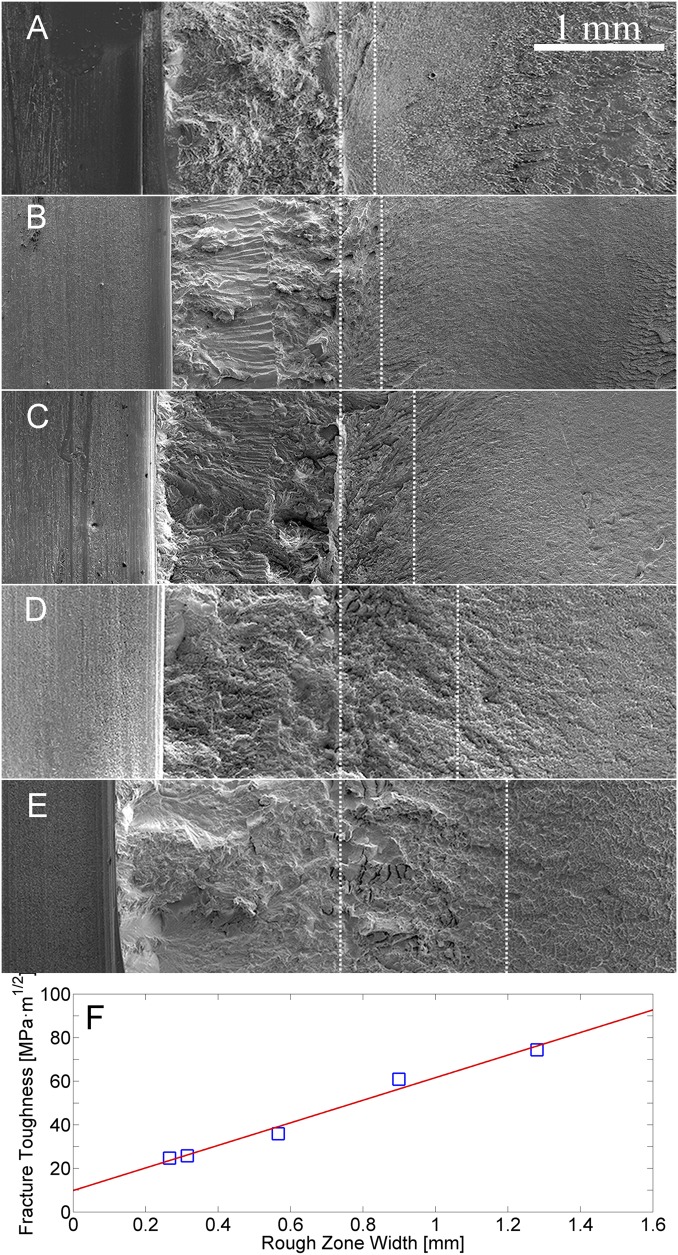
Fig. 3.
Scanning electron micrographs of the fracture surfaces from fractured specimens associated with equilibrium states of Zr35Ti30Cu8.25Be26.75 metallic glass at various relaxation temperatures TR: (A) 533, (B) 553, (C) 573, (D) 593, and (E) 613 K. The precrack surfaces in the fractographs are aligned and designated by dotted lines. The extent of the rough zone width Lrough in each fractograph is also designated by a dotted line. (F) Fracture toughness KIC vs. rough zone width Lrough for the conditions in A–E. The solid line is a linear fit through the data.

