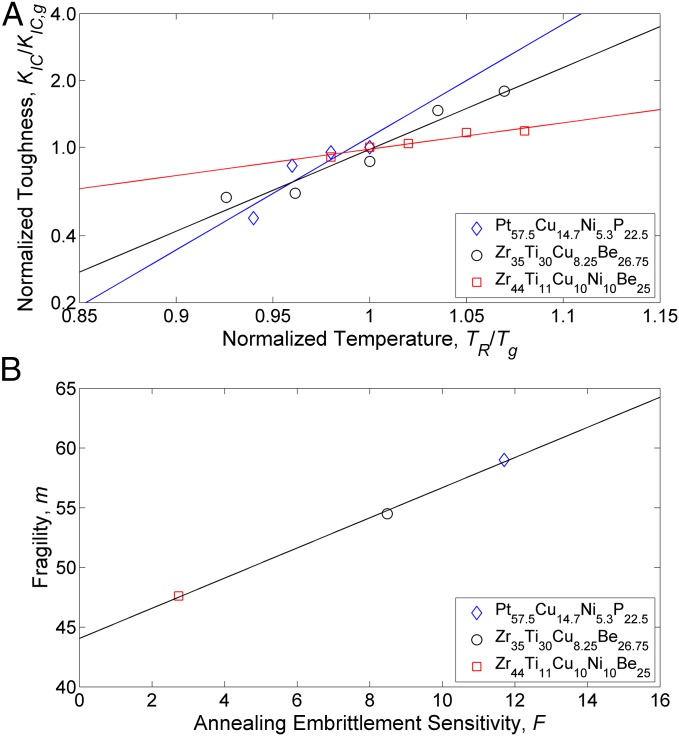
Fig. 4.
(A) Logarithm of normalized toughness vs. normalized temperature for Zr35Ti30Cu8.25Be26.75, Pt57.5Ni5.3Cu14.7P22.5, and Zr44Ti11Cu10Ni10Be25. Solid lines are regressions through the data. (B) Fragility m vs. tendency for annealing embrittlement F for Zr35Ti30Cu8.25Be26.75, Pt57.5Ni5.3Cu14.7P22.5, and Zr44Ti11Cu10Ni10Be25. The line is a linear fit through the data.

