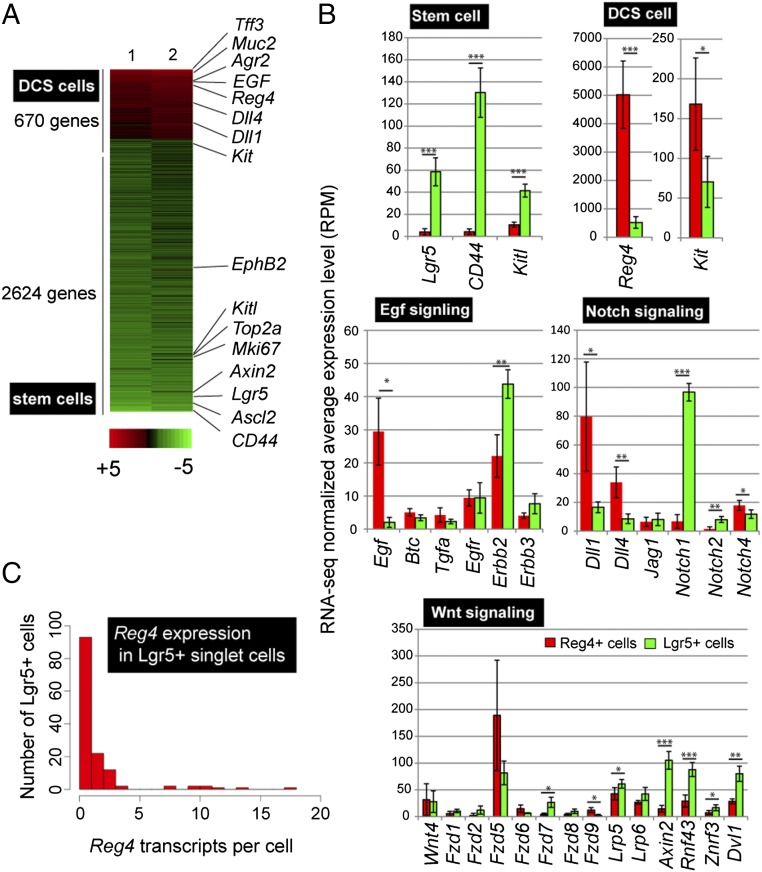
Fig. 2.
Transcriptome analysis of Reg4+ DCS cells. (A) Comprehensive gene expression pattern analysis by RNA-seq using sorted Reg4+ DCS and Lgr5+ stem cells. Heat map was generated by using genes with a minimal mean fold change of 2 between the two cell types, after which 3,294 genes were left. DCS cell genes are indicated in red and stem cell genes are shown in green. (B) Average (RPM) value of genes encoding marker for DCS cells, stem cells, and pathway components of Egf signaling, Notch signaling and Wnt signaling in Reg4+ cells (red) and Lgr5+ cells (green). Mean and SD are shown (n = 4). P values from two-tailed Student’s t test: *P < 0.05, **P < 0.01, ***P < 0.001. (C) Histogram shows the number of detected Reg4 transcripts in Lgr5+ sorted single cells. Transcriptomes of all cells with >1,500 transcripts were downsampled to 1,500 total transcripts.

