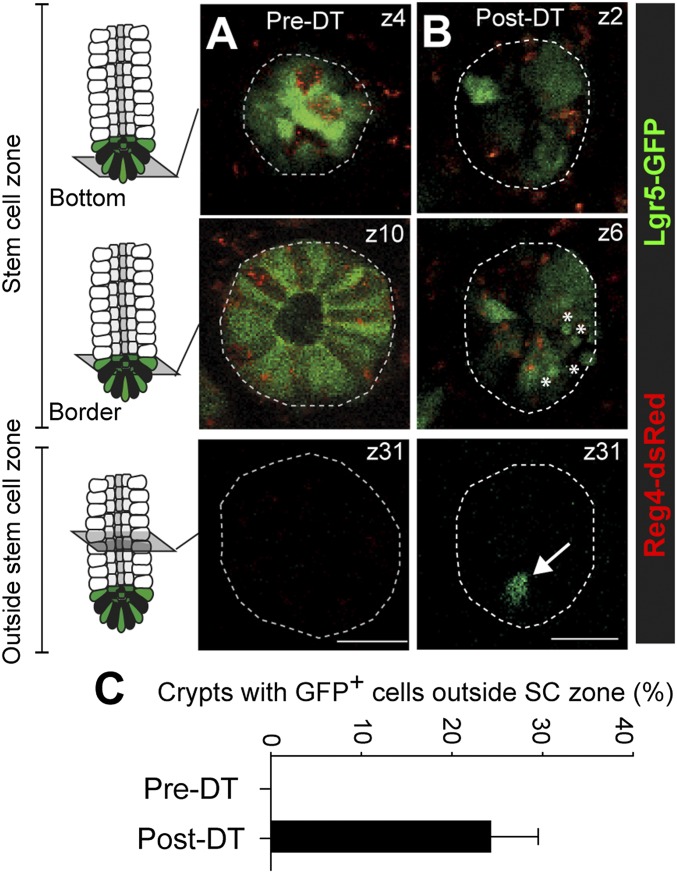
Fig. 4.
Lgr5+ stem cell dynamics upon elimination of DCS cells in living Reg4DTR-Red mice. (A and B) Intravital imaging of Lgr5-GFP::Reg4DTR-Red mice to follow the dynamics of colonic stem cells and DCS cells after targeted ablation of Reg4+ cells (in red), induced by 4–6 d of DT administration. Shown are representative x-y images of crypts at indicated z-stack positions, without treatment (A) and after administrations of DT (B). Note the appearance of Lgr5+ cells (green) outside the stem cell zone upon depletion of Reg4+ cells (indicated by an arrow at B, Lower). Apoptotic bodies are indicated by asterisks (B, Middle). Dotted lines indicate crypts. (C) Graph shows presence of Lgr5+ cells outside the stem cell zone in crypts before and after depletion of Reg4+ cells (n = 179 and 167 crypts pre-DT and post-DT respectively, in 3 mice). Error bars represent SEM. (Scale bars: 25 µm.)

