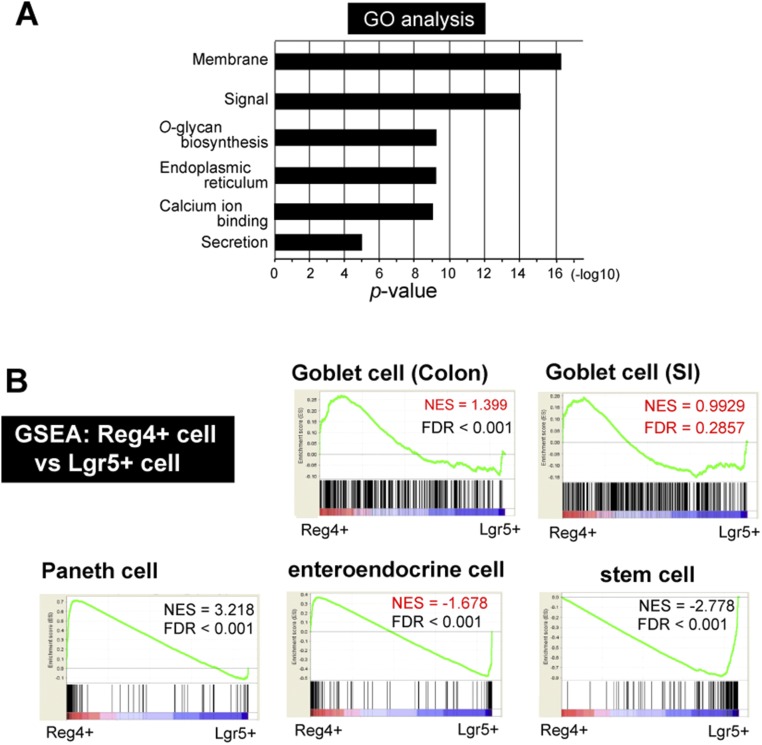
Fig. S4.
Characterization of gene signature of Reg4+ DCS cells in RNA-seq. (A) GO enrichment analysis for differentially expressed genes in Reg4+ DCS cells. The y axis shows the P value (−log10). (B) GSEA. Genes significantly enriched in Reg4+ (red, Left) and Lgr5+ (blue, Right) population are given on the x axis. Input gene sets were generated from public datasets: “Goblet cells in colon” and “Goblet cells in SI” were defined as the 200 most highly expressed in CD45−/CD24−/CK18+/UEA-1+ Goblet cells (GEO: GSE52418), 200 most differentially expressed genes in “Paneth cells genes” from sorted Paneth cells vs.Lgr5+ stem cells, in “enteroendocrine (ee) cells” from sorted ee cells vs. Lgr5+ stem cells (GEO: GSE25109), and “stem cell genes” in Lgr5-GFP high stem cells vs. Lgr5-GFP low daughter cells (GSE25109). FDR, false discovery rate; NES, normalized enrichment score. Reference of Goblet cell of Colon and SI; highly expressed in CD24− CK18+ UEA-1+ population (top 200 genes) Knoop et al. (24), Paneth, and enteroendocrine cell; genes enriched in sorted Paneth or enteroendocrine cells versus sorted Lgr5 stem cells (top 200 genes) Sato et al. (8), stem cell; Lgr5-GFP high versus low (top 200 genes) Muñoz et al. (25).

