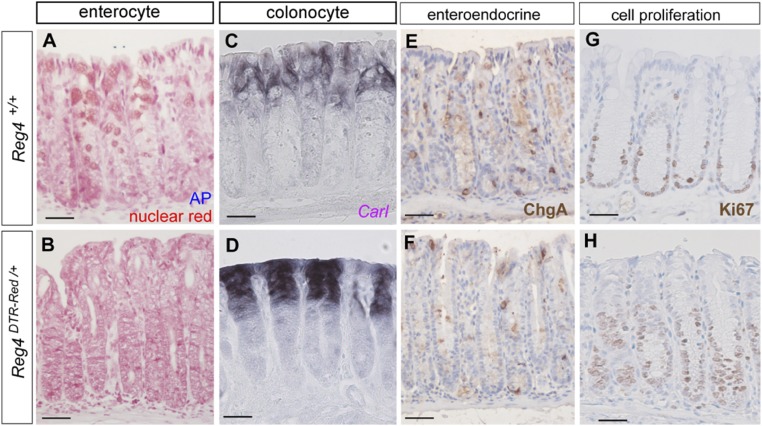
Fig. S8.
Marker expression analysis of crypts after DT administration. (A and B) Alkaline phosphatase staining (enterocyte, blue) and nuclei are stained with nuclear red (red) as a counterstain in control (A) and Reg4DTR-Red/+ mouse 6 d after DT injections (B). (C and D) In situ hybridization using CarI-specific antisense mRNA probe (purple, colonocyte marker) in control (C) and Reg4DTR-Red/+ mouse 6 d after DT injections (D). (E–H) Immunohistochemistry analysis of ChgA (E and F: enteroendocrine cell), and Ki67 (G and H) are carried out in control (E and G) and Reg4DTR-Red/+ (F and H) 6 d after DT administration. (Scale bars: 50 µm.)

