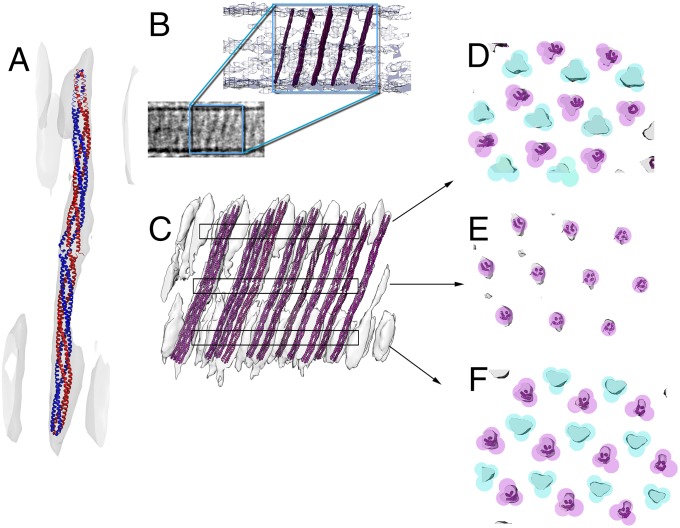
Fig. 2.
MDFF of the homology model of the double signaling domain chemoreceptor DosM. (A) The homology model of a DosM receptor dimer (blue/red) was fit into the pillar-like electron density of the subvolume average using MDFF. (B) Several copies of the homology model of DosM were superimposed onto the electron density from the unaveraged electron tomogram, preserving both distribution and tilt angles from the fit into the subvolume average map shown in C. (C) Fitting of the homology model into the pillar-like electron densities of the subvolume average. (D–F) Cross-section of the areas marked in C, showing the locations of DosM correlating with every other trimer-of-dimer in the lattice. Each colored circle indicates a dimer; turquoise indicates dimers that are part of a trimer that is lacking DosM, and magenta indicates dimers that are DosM or are part of a DosM-containing trimer.

