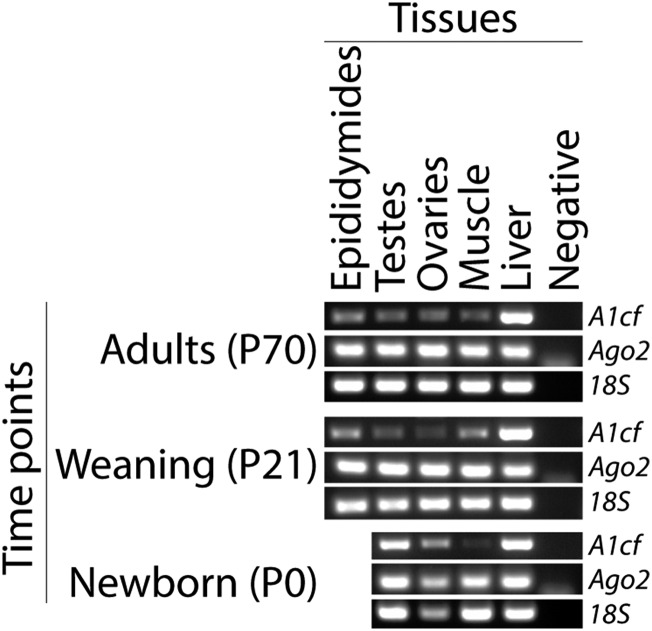
Fig. S2.
A1cf transcript expression and structure in mouse. Relative levels of A1cf transcript and, for comparison, Ago2 transcript and 18S ribosomal RNA (internal control) in epididymides, testes, and ovaries and in muscle and liver (referents for low and high levels of A1cf, respectively) of adult (P70), weaning (P21), and newborn (P0) 129/Sv females and males. A negative control is included for each set of primers.

