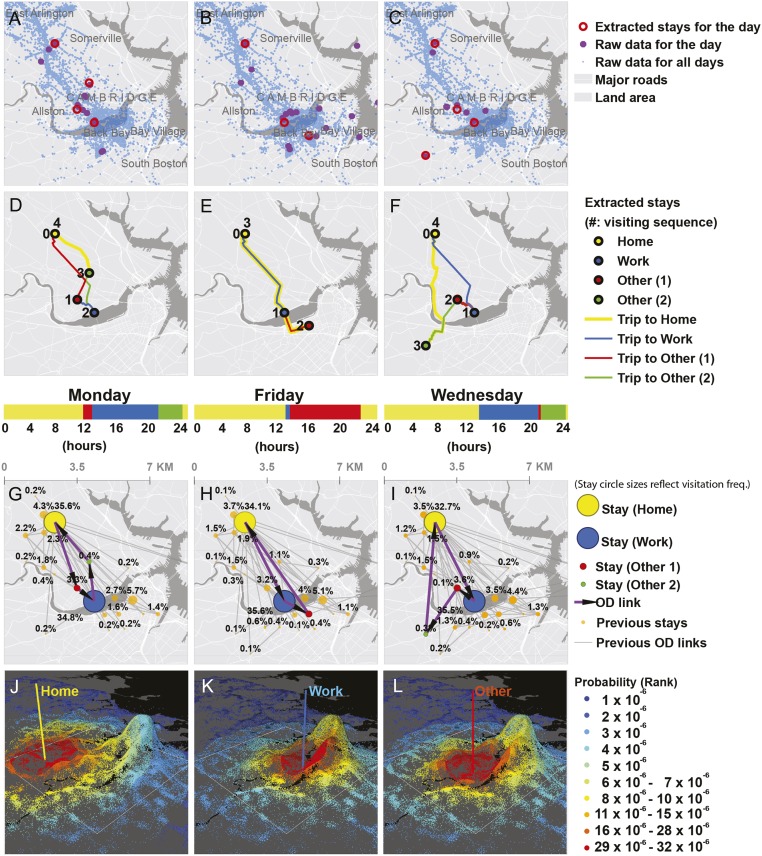
Fig. 1.
Extraction of stays and daily journeys from raw cell phone data. (A–C) Stay locations extracted from the self-collected cell phone records of a student in three sample days. (D–F) Illustration of trips between consecutive stays in each day. (G–I) Visitation frequency of all locations, counting from the first day of the observation period to the current day. For this individual, home and work stays dominate all visits. Highlighted arrows mark the trips on that day. The time bar above each subfigure is color-coded by activity type based on each stay’s duration. (J–L) Illustration of the rank-based EPR model. To illustrate different cases we use the individual’s home, work, and one other location as trip origins. The potential trip destinations are color-coded by different chosen probabilities based on their rank. The closer a location is to the origin, the higher the probability it has to be chosen. The height of the dots represents the density of destinations in the surrounding region. The most dense place for other type of activities is in downtown Boston.

