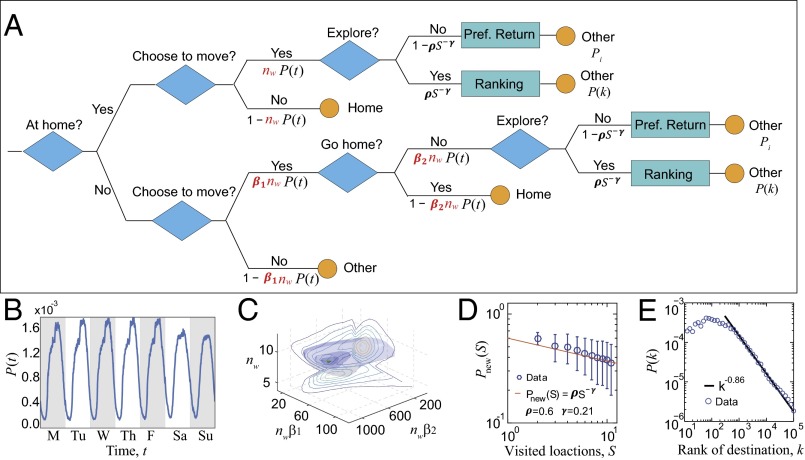
Fig. 2.
Flowchart of TimeGeo and input features extracted from active CDR users. (A) Spatial and temporal choices per time step. Three individual specific parameters control temporal patterns, including the weekly home-based tours (), dwell rate (), and the burst rate (). influences the travel likelihood when a person is at home, influences the travel likelihood when a person is out of home, whereas influences the likelihood of performing consecutive out-of-home activities. (B) shown here is the empirical travel circadian rhythm in an average week measured from data for active noncommuters (who have no journey-to-work trips). (C) Joint distribution of , , and for active noncommuters in the CDR data set. The 2D marginal distributions are shown by the contour plots. The green dot is the most probable parameter value combination with , , . (D) Empirical probability to visit a new location as a function of distinct visited locations S; it follows . (E) Empirical probability of choosing the rank k location as a trip destination follows .

