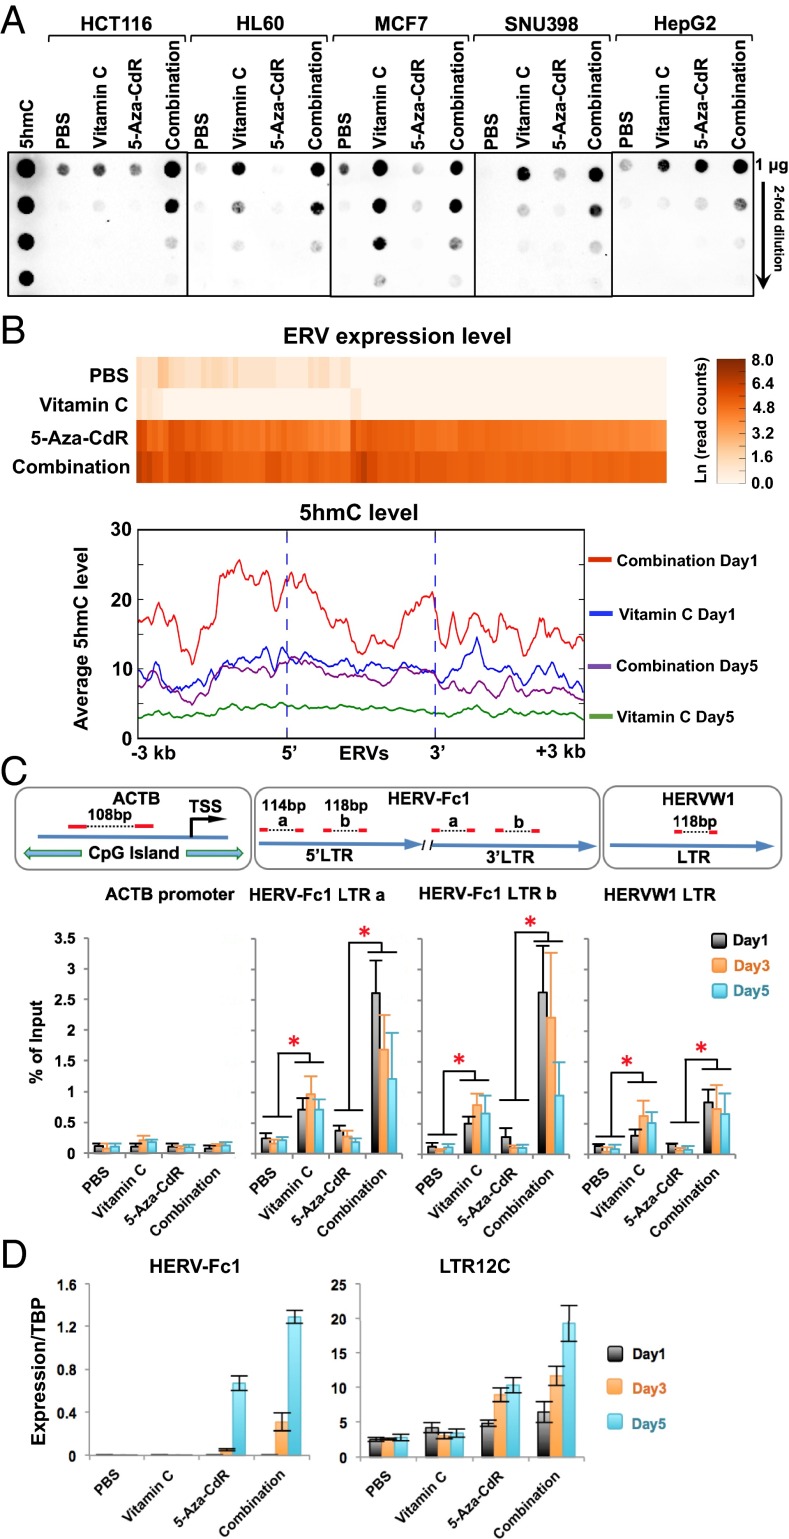
Fig. 4.
Combination treatment promotes 5hmC production at ERV LTRs. (A) Dot blot analysis of global 5hmC levels in cancer cells on day 5 after treatment with an antibody against 5hmC. (B) Genomewide analysis of 5hmC at up-regulated ERV loci in HCT116 cells on days 1 and 5 after vitamin C and combination treatment. The top 100 most up-regulated ERVs after combination treatment compared with untreated cells were identified by RNA-seq, and 5hmC enrichment and were analyzed using the Hydroxymethyl Collector Kit (Active Motif) followed by next-generation sequencing. (Upper) The heat map shows the expression levels of individual ERVs in the unit of natural log read counts. (Lower) The average base counts of 5hmC reads at all ERV loci and their ± 3-kb flanking region. (C, Lower) Quantification of 5hmC in HCT116 cells at LTRs of ERVs on days 1, 3, and 5 after treatment by qPCR. (Upper) Primer design. The promoter region of β-actin (ACTB) was used as a negative control. Values are presented as mean ± SD of five independent experiments. *P < 0.05 by Student’s t test. (D) Expression of HERV-Fc1 and LTR12C transcripts in HCT116 cells at days 1, 3, and 5 after treatment relative to the TATA-binding protein (TBP) levels by quantitative RT-PCR. Values are mean ± SD of three independent experiments.

