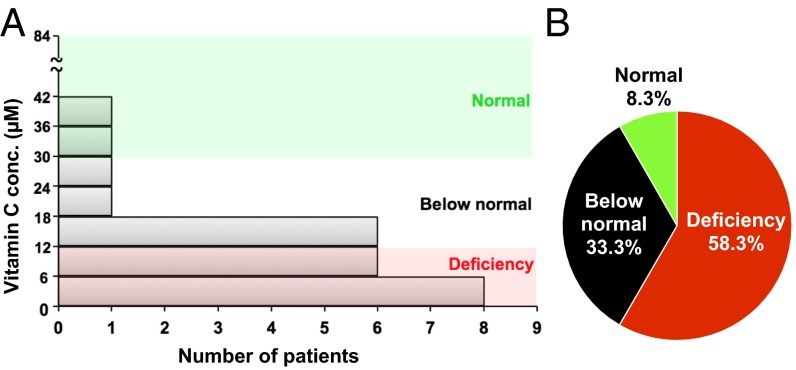
Fig. 7.
Plasma vitamin C concentrations in patients with hematopoietic malignancies. (A) The bar graph shows the distribution of plasma vitamin C levels in 24 patients with hematopoietic malignancies who were not taking vitamin C supplements. (B) The pie chart shows the percentage of patients with vitamin C deficiency (plasma level <11.4 μM), patients with levels below normal (11.4–26 μM), and patients with levels within the normal range (26–84 μM).

