Figure 5.
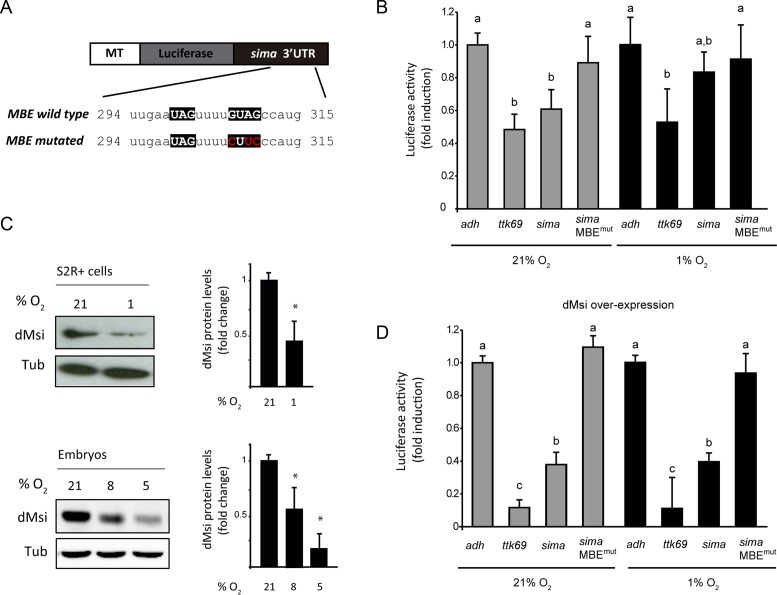
dMusashi represses Sima translation in normoxia. (A) Schematic representation of firefly luciferase reporter constructs containing wild type or mutagenized versions of the sima 3′ UTR. Mutations (shown in red) have been generated within the Musashi Binding Element (MBE) by site-directed mutagenesis. The reporters were transiently transfected in S2R+ cells and expressed under control of a copper-inducible metallothionein promoter (MT). (B) S2R+ cells transfected with luciferase reporters containing the alcohol dehydrogenase (adh) 3′ UTR (negative control), tramtrack69 (ttk69) 3′ UTR (positive control), or sima 3′ UTR (either wild type or mutagenized, MBE mut) were maintained in normoxia or exposed to hypoxia (1% O2 20 h), and luciferase activity of cell lysates was measured, using a copper-inducible Renilla luciferase construct for normalization. In normoxic but not in hypoxic cells, sima 3′ UTR represses luciferase activity to a similar extent to ttk69 3′ UTR; sima 3′ UTR mutagenized in the MBE loses completely its repressive activity. (C) Western blot analysis of dMsi protein levels in S2R+ cells in normoxia or hypoxia (1% O2 20 h), as well as in embryos maintained in normoxia (21% O2) or exposed to hypoxia (8% or 5% O2 for 5h). Both in cell culture and in vivo, dMsi protein levels are sharply reduced in hypoxia. Tubulin was used as a loading control. Error bars represent SEM (n = 3, *P < 0.05; **P ≤ 0.01; Student's t test). (D) Cells transfected with the same set of reporters as in panel B) were co-transfected with a dMsi overexpression vector (pAc-dMsi) and maintained in normoxia or exposed to hypoxia (1% O2 20 h). dMsi overexpression enhances the repression exerted by ttk69 or sima 3′ UTRs irrespective of oxygen levels (compare with panel B), while the mutagenized version of sima 3′ UTR loses its repressive capacity. Luciferase activity is depicted as fold induction respect to the activity of the adh 3′ UTR reporter (negative control). In (B) and (D), error bars represent SEM (n = 3; different letters indicate statistical differences with a P < 0.05 in a one-way ANOVA with a Bonferroni post-hoc test).

