Figure 1.
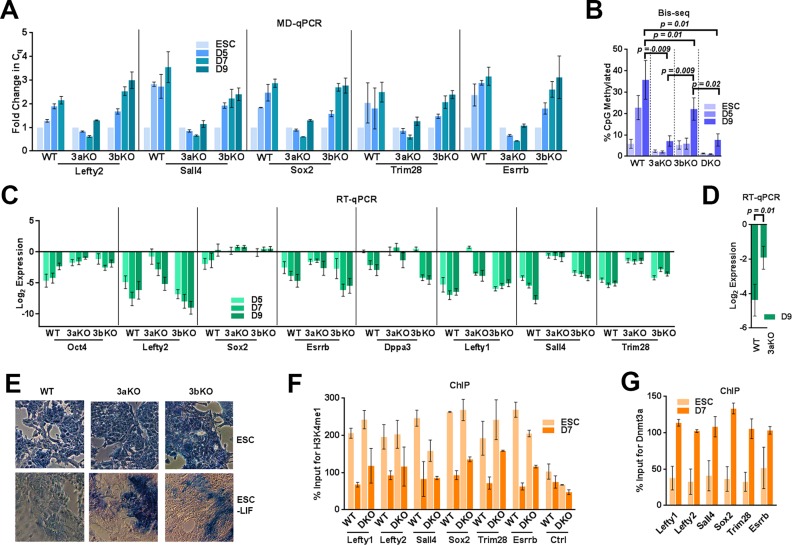
Dnmt3a is the principal methyltransferase for PpG enhancer methylation. ESC: undifferentiated embryonic stem cells and D3–D9: Days post-induction of differentiation WT: Wild Type, 3aKO: Dnmt3a-/-, 3bKO: Dnmt3b-/-, DKO: Dnmt3a-/- Dnmt3b-/-. DNA methylation analysis of the PpG enhancers by (A) MD-qPCR and by (B) bisulfite sequencing (Bis-seq). For MD-qPCR, genomic DNA was digested with the restriction enzyme MspJI that cuts methylated DNA, followed by qPCR at PpG enhancers (illustration in Supplementary Figure S2B). An increase in the Cq (quantification cycle) represents the gain in DNA methylation. For Bis-seq (B) bisulfite-treated gDNA was used to determine the extent of CpG methylation at the PpG enhancers shown in A on a high throughput sequencing platform (MiSeq) and the data were analyzed using Bismark software. The number of CpGs, reads analyzed for each enhancer and percent CpG methylation by site in all cell lines and treatments are given in Supplementary Tables S1, S2, S3 and Materials and Methods. (C) Gene expression analysis of PpGs by RT-qPCR in WT and Dnmt3 KO cells; undifferentiated and post induction of differentiation. Gene expression is normalized to Gapdh and represented as a relative change to gene expression in ESC. (D) Average gene expression change across all 8 PpGs D9 post differentiation in Dnmt3aKO compared to WT. P-values are derived from Student's paired t-test (E) Alkaline phosphatase staining (blue) for pluripotency in ESCs and differentiated cells D9 post-induction, where the presence of stain indicates pluripotency. (F and G) ChIP-qPCR was used to determine percent enrichment of (F)H3K4me1 in WT and DKO cells (G) Dnmt3a in WT cells at PpG enhancers pre- and post-induction of differentiation. For A, C, F and G average and SD are shown for each gene.

