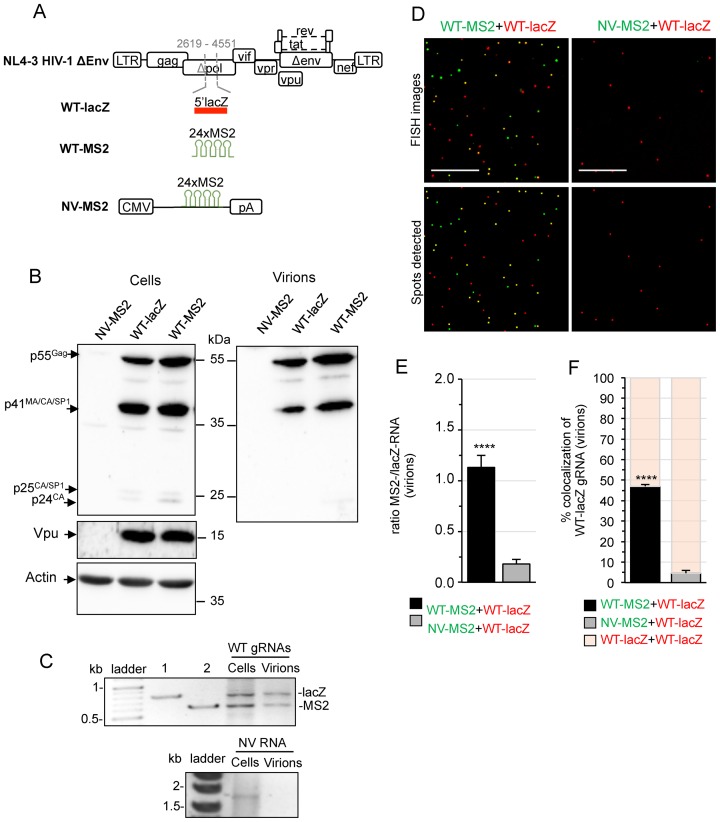
Figure 1.
Dual-RNA labeling system and FISH analysis of heterodimeric RNA in virions. (A) Schematic representation of the constructions used in the study. HIV-1 tagged genomes were constructed by replacing a portion of the pol gene in NL4-3Δenv plasmid with 5′-lacZ (WT-lacZ) or 24xMS2 (WT-MS2) sequences to allow specific detection of unspliced RNA (positions and numbers indicated in gray refer to HIV-1 DNA nucleotides). NV-MS2 encodes a non-viral RNA containing 24xMS2 repeats from a pcDNA3 backbone. (B) Western-blotting of protein extracts from HeLa cells and purified virions from culture supernatants at 24 h pt with WT-lacZ, WT-MS2 or NV-MS2 plasmids. The expression of Gag (55kDa), Vpu (16 kDa) and Actin (42 kDa) is shown. The quantification of three independent blots revealed that cells transfected with the LacZ construct produced 84 ± 30% of Gag produced with the MS2 construct (P = 0.4). (C) RT-PCR analysis of tagged RNAs in the cells and viruses used for FISH analyses. For dual-WT RNA detection, the RT was initiated with the same primers followed by a PCR step with two sense primers (one specific for lacZ and one for MS2) together with a common antisense primer in the same PCR reaction, generating two amplicons with specific sizes. Lanes 1 and 2 in the agarose gel correspond to the amplification of WT-lacZ and WT-MS2 plasmids, respectively (n ≥ 3). NV-MS2 is detected by another RT-PCR system using specific primers (n = 2). (D) Representative images of lacZ- (red) and MS2-tagged (green) RNAs visualized by single-molecule FISH of virus preparations. Images were obtained with a 100×-oil objective in a wide-field fluorescence microscope. Scale bar is 10 μm. The lower images show the center positions of identified spots. (E) Ratio between the number of green and red fluorescent spots. (F) Percentage of WT-lacZ RNA colocalized with WT-MS2 or NV-MS2 RNA. The fraction of bars filled in red represent the remaining proportion of WT-lacZ gRNA engaged in homodimers. Data are the mean ± SEM of three independent transfections (counting ≥1000 red spots per sample) and the significance of differences with control (NV-WT) was assessed using an unpaired Student's t-test (****P ≤ 0.0001).

