Figure 2.
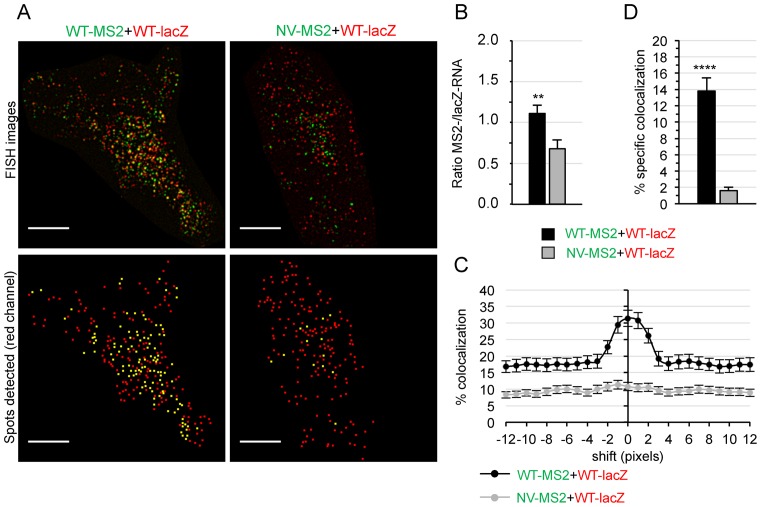
Analysis of gRNA colocalization at the PM by two-color TIRFM. (A) Representative TIRFM images of HeLa cells co-transfected with WT-lacZ (red) and WT-MS2 or NV-MS2 (green) plasmids for 24 h, obtained by TIRFM. The lower images show the centers of red spots (red) and those that colocalized with a green spot in yellow. Scale bars are 10 μm. (B) Ratio of green to red spots (**P ≤ 0.01). (C) Plot showing the decay of colocalized WT-lacZ RNA (red) with increasing shifts of the green image in both directions of the x-axis. The asymptotic part of the curve is used to define unspecific colocalization for each cell. (D) Percentage of specific colocalization (with respect to WT-lacZ RNA) calculated by subtracting the unspecific colocalization rate (averaged from x-shifts of ±8–12 pixels) to the original one for each image. All data correspond to the mean ± SEM of at least 30 cells from two independent transfections. The significance of differences with control (NV-WT) was assessed using an unpaired Student's t-test (****P ≤ 0.0001).

