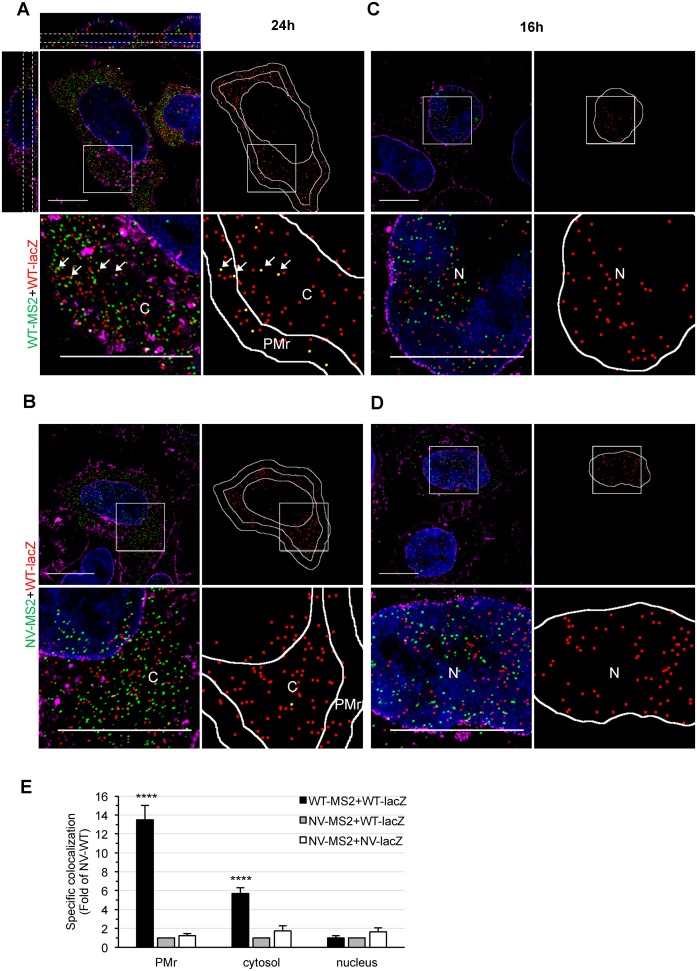
Figure 3.
3D-SIM study of HIV-1 gRNA colocalization in cells. (A–D) Representative 3D-SIM images of HeLa cells co-transfected with WT-lacZ+WT-MS2 (A, C) or WT-lacZ+NV-MS2 (B, D) for 24 h (A, B) or 16 h (C, D) and labeled by FISH with MS2 (green) and lacZ probes (red). The nucleus and membranes are stained with DAPI (blue) and WGA (magenta), respectively. Image stacks of the whole cell depth were acquired with a Z-step size of 125 nm, reconstructed and shown as maximal intensity projections of 3–5 Z-slices. The orthogonal views shown for the first image (A, upper left) illustrate the cell depth considered for quantitative analyses (dotted white lines). Blow ups correspond to zoom in areas of the image (white squares). For each cell, the center positions of red spots and those that colocalized with a green spot are shown in red and yellow, respectively. The PMr, cytosol (C) and nucleus (N) were defined (white lines) for analysis. Scale bars are 10 μm. (E) Specific colocalization values normalized to the negative control WT-lacZ+NV-MS2 RNA are presented as the mean ± SEM of 30 cells from at least two independent transfections. The significance of differences with controls (NV-WT or NV-NV) was assessed using an unpaired Student's t-test (****P ≤ 0.0001).

