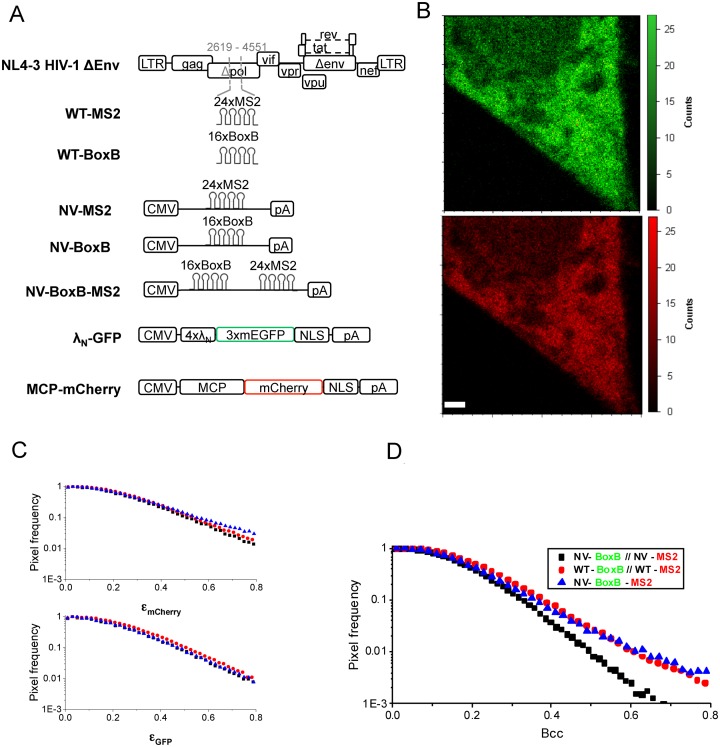
Figure 4.
Cross-N&B analysis of HIV-1 gRNA dimerization in the cytosol of living cells. (A) Schematic representation of the constructions used in this study. (B) Representative image of a HeLa cell transfected with WT-MS2, WT-Box B, MCP-mCherry and λN-GFP, obtained by 2-photon laser scanning microscopy, and used for N&B analysis (top : GFP channel, bottom : mCherry channel). Scale bar is 2 μm. Apparent brightness (ϵGFP and ϵmCherry) (C) and Cross Brightness (Bcc) (D) pixel frequency histograms for WT-MS2+WT-BoxB (red disks), NV-MS2+NV-BoxB (negative control, black squares) and NV-BoxB-MS2 (positive control, blue triangles). The high frequency of pixels with a high Bcc for the WT-MS2+WT-Box B construct reflects the interactions between these two HIV-1 gRNAs in the cytosol. Experiments were performed over five independent days and on average measurements on 30 different cells.

