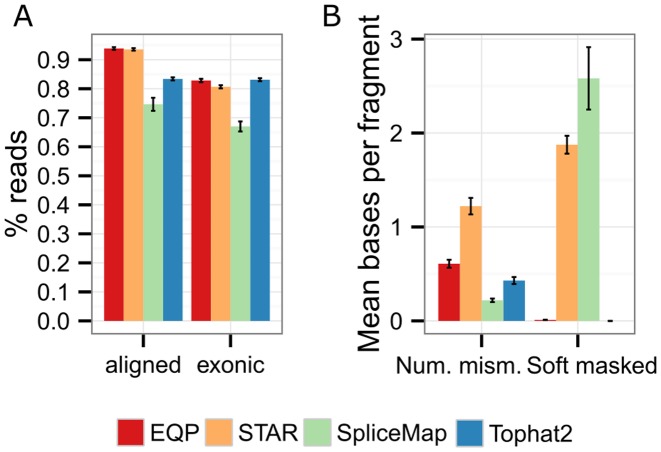
Figure 4.
Comparison of the EQP alignment module to other aligners. (A) The percentage of reads of the SEQC samples aligned to the reference genome (left) and the percentage of reads overlapping exons (right) for the four aligners EQP (Bowtie2), STAR, SpliceMap and Tophat2. The error bars are the standard deviation across all 64 input Fastq files. (B) The mean number of mismatches and the mean number of soft masked bases per (paired-end) read.

