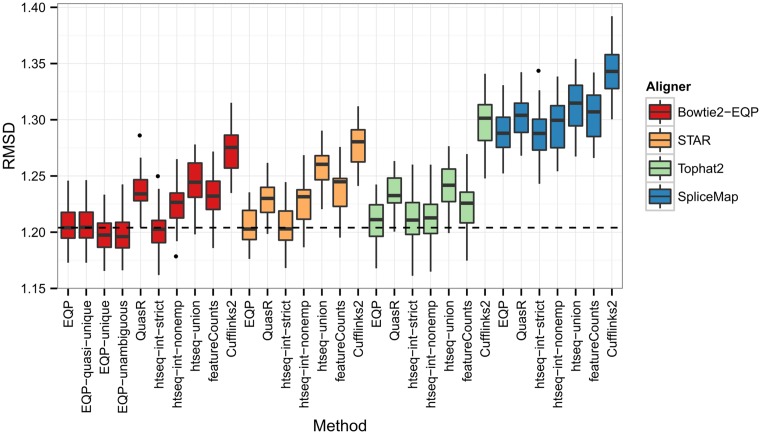
Figure 7.
The distribution of RMSD values for different quantification methods and aligners. Each box plot reflects 32 values computed between the Taqman mean gene expression fold changes and the gene count fold changes of sample SEQC-A versus SEQC-B for different lanes of the RNA-seq data. For EQP we consider four parameter settings: counting reads with up to 100 or up to 10 genomic alignments (EQP and EQP-quasi-unique), with unique genomic alignments (EQP-unique), and with unambiguous genomic alignments (EQP-unambiguous).

