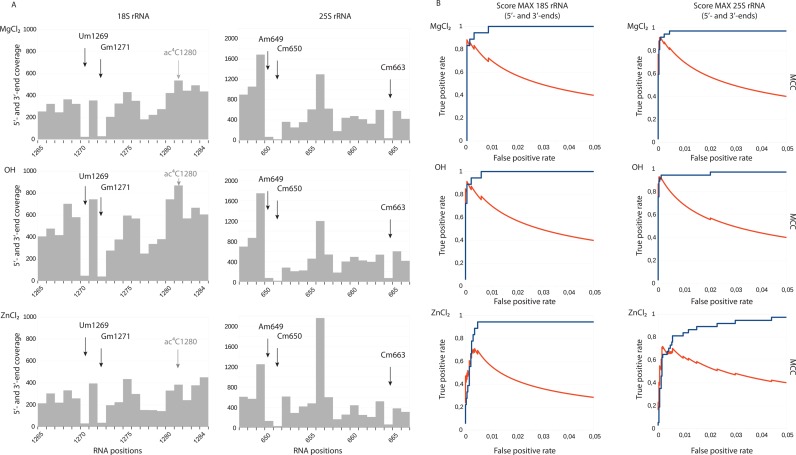
Figure 2.
2′-O-Methylation analysis using RNA fragmentation with MgCl2, alkaline bicarbonate buffer (OH−) and ZnCl2. Panel (A) Typical fragmentation profiles for regions of yeast 18S and 25S rRNA are shown. Arrows indicate the +1 positions for 2′-O-Me residues. 18S rRNA contains another RNA modification, ac4C, which is present nearby, but does not generate a signal (shown in gray). Panel (B) Performance of each method was compared by calculation of score MAX to detect known 2′-O-methylations followed by construction of Receiver Operating Characteristic (ROC) curves (blue). Matthews Correlation Coefficient (MCC) is traced in red on the same graph.

