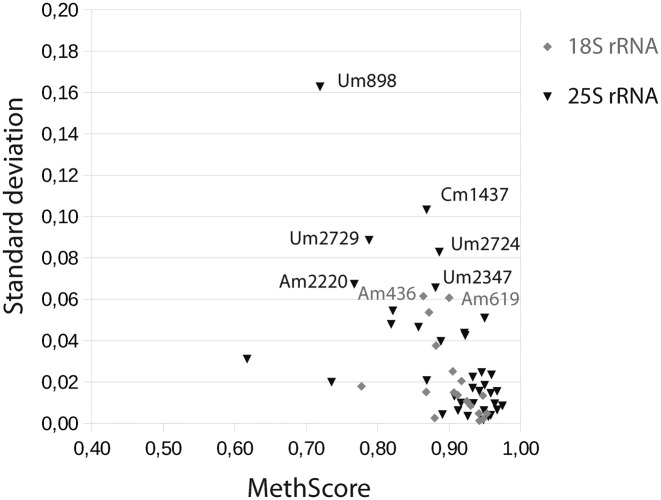
Figure 4.
RiboMethSeq analysis performed with a reduced amount of input RNA. The results of MethScore values were calculated for all modified positions in yeast 18S and 25S rRNA for 1 ng and for 250 ng of input total RNA. Mean values obtained with their SD values are traced on the graph, 18S data are in gray, 25S data are in black, respectively.

