Figure 2.
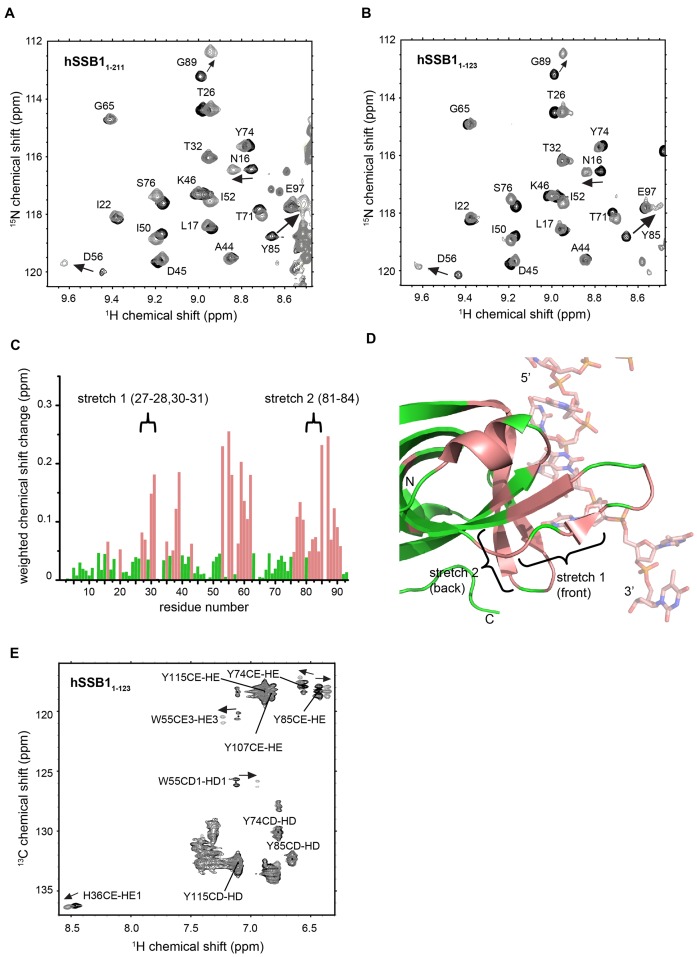
NMR analysis of hSSB1 OB domain in complex with ssDNA (oligo(dT)6). Sections of 15N-HSQC spectrum of full-length hSSB1 (hSSB11-211) (A) and hSSB11-123 (B) in the absence (black) and presence (1:1 mixture, light grey) of oligo(dT)6, respectively. Assignments and directions of movement are indicated. (C) Weighted backbone chemical shift changes of HN and N (26) atoms for hSSB11-123 upon binding to ssDNA. Residues exhibiting changes larger than the average (solution binding residues) are coloured in salmon. Two stretches of residues (stretch 1 and 2) that exhibit larger than average chemical shift changes but are not involved in ssDNA binding in the published X-ray crystal structure of the SOSS1 complex (PDB ID: 4OWX) (21) are indicated. (D) Cartoon representation of the published crystal structure with solution binding residues coloured as in C and residue stretches 1 and 2 indicated. (E) Portion of 13C HSQC spectrum of hSSB1-123 in the absence (black) and presence (1:1 mixture, light grey) of oligo(dT)6, respectively.

