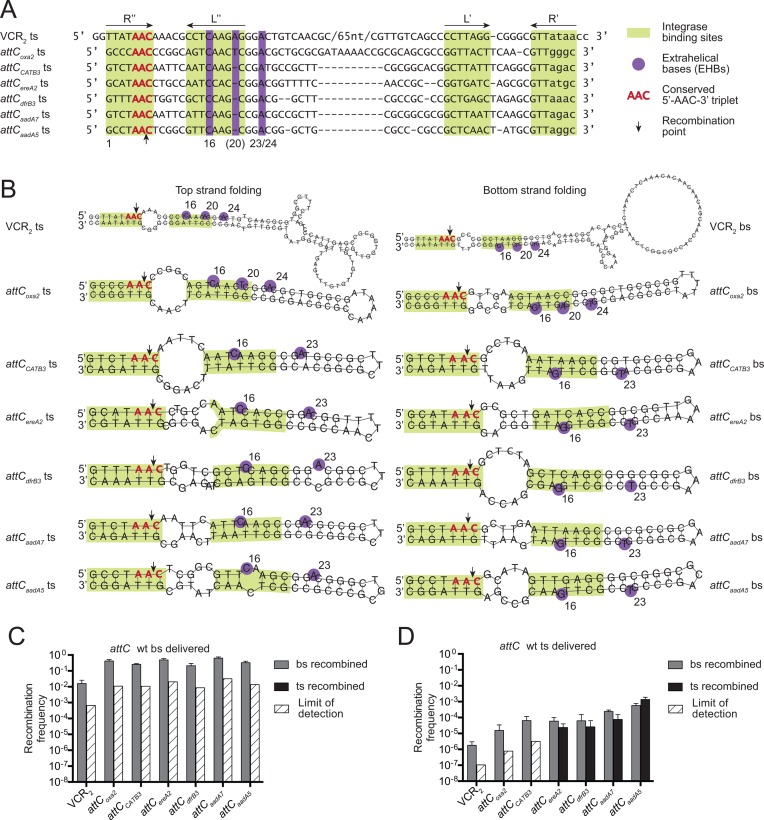
Figure 2.
Wild-type attC site recombination. (A) Alignment of top strands of attC sites, based on CLUSTAL W 2.1 results, with manual adjustments to align the complementary L and R boxes and the EHBs. (B) Structures of top and bottom strands of attC sites, predicted by RNAfold program from the ViennaRNA2 package (37), with imposed constraints to pair the L and R boxes. (C and D) Recombination frequencies and recombination point localizations for different wild-type attC sites upon the delivery of the bottom strand (C) or the top strand (D). The bars correspond to recombination frequencies of each strain: grey bars for recombination of the bottom strand; black for recombination of the top strand. White cross-hatched bars correspond to the limits of detection by PCR (Supplementary Material S5), when recombination events of a particular strand were not observed. Values represent the mean of at least three independent experiments and error bars correspond to average deviations from the mean.

