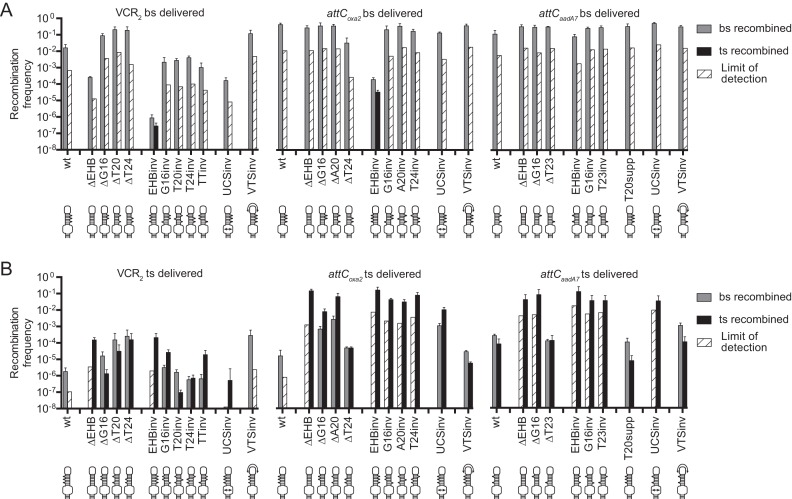
Figure 3.
Recombination frequencies and recombination point localizations for different attC site mutants upon the delivery of the bottom strand (A) or the top strand (B). The bars correspond to recombination frequencies of each strain: grey bars for recombination in the of the bottom strand; black for recombination of the top strand. White cross-hatched bars correspond to the limits of detection by PCR (Supplementary Material S5), when recombination events of a particular strand were not observed. Values represent the mean of at least three independent experiments and error bars correspond to average deviations from the mean. EHB, Extrahelical Bases; UCS, Unpaired Central Spacer; VTS, Variable Terminal Structure; inv, inversion; supp, supplementary. Schemes below the graphs represent the structure of corresponding attC site mutants.

