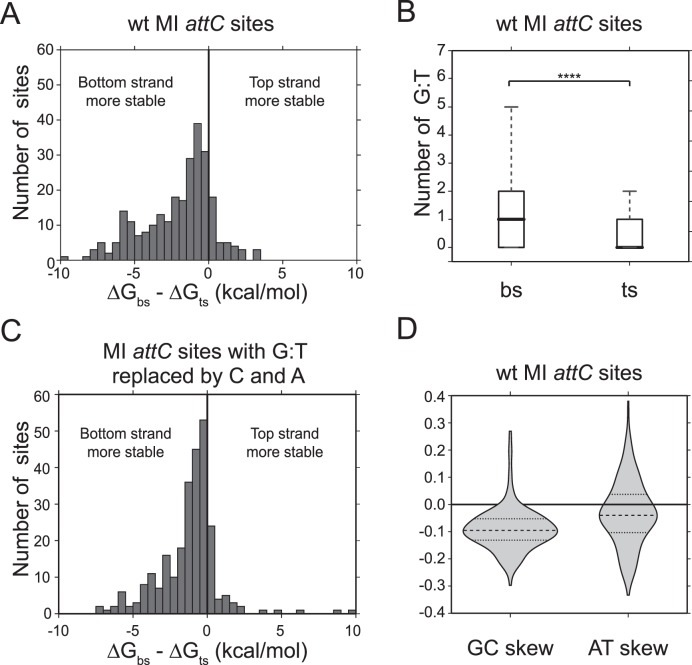
Figure 5.
Analysis of 263 attC sites of Mobile Integrons from the INTEGRALL database (36). ΔG values were calculated with RNAfold program from the ViennaRNA2 package (37). (A) Difference in ΔG (kcal/mol) between bottom and top strands of wt attC sites. (B) Difference between the mean number of G:T mispairs on the bottom and top strand (t-test, P < 0.0001). (C) Difference in ΔG (kcal/mol) between bottom and top strands of sites where G:T mispairs were replaced by non-pairing C and A. (D) GC and AT skews calculated for the attC site top strand. Negative skews correspond to the enrichment of purines Guanine (G) and Adenine (A) on the bottom strand.

