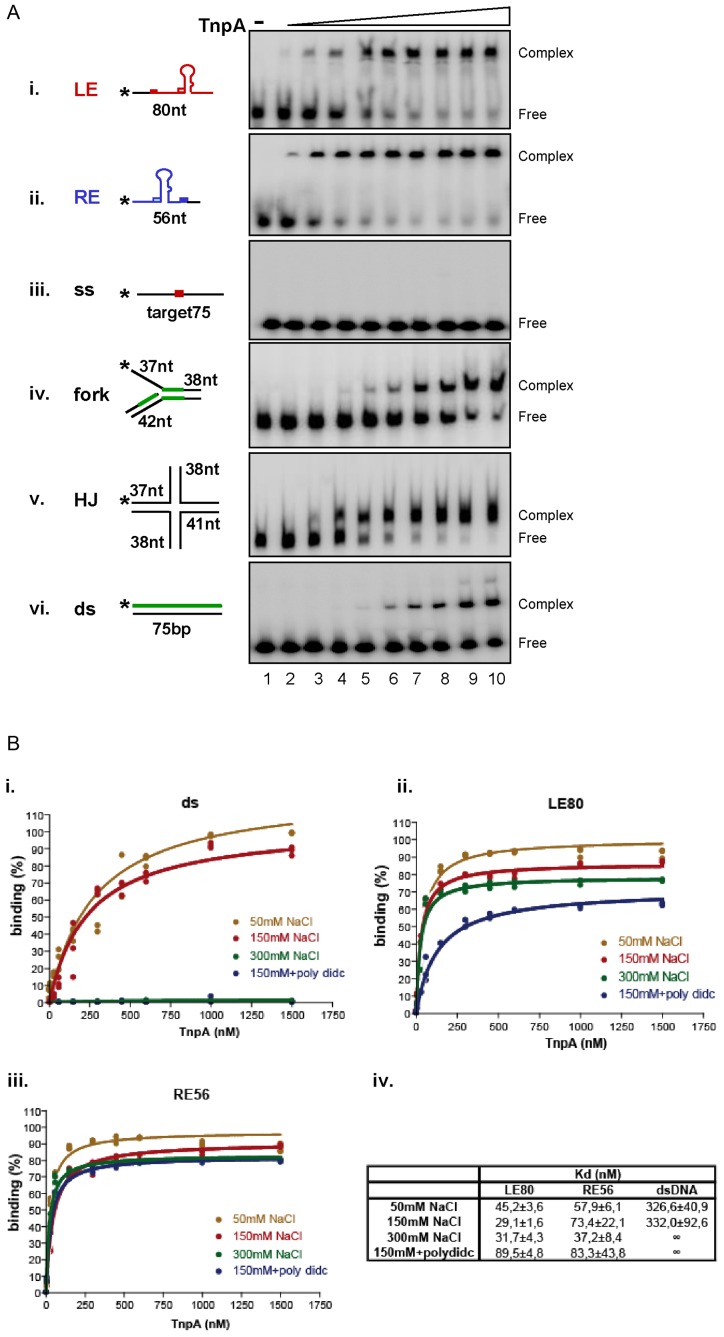
Figure 4.
TnpAIS608 DNA binding properties. (A) Binding to different substrates by EMSA. EMSA analysis of complexes formed between TnpAIS608 and different DNA substrates. The same conditions were used for all the substrates (i–vi). ‘-’ indicates no TnpAIS608-His6. Increasing TnpAIS608-His6 concentrations (6, 30, 60, 150, 300, 450, 600, 1000 and 1500 nM; lanes 2–10 respectively) are indicated by the triangle. Complexes were separated in native 5% polyacrylamide gels. i. ssLE; ii. ssRE; iii. ss target, iv. flap structured substrate, v. Holiday Junction substrate and vi. ds substrate. TnpAIS608 protected regions revealed by copper-phenanthroline footprinting are indicated in green (Supplementary Figure S4). (B) Double filter-binding analysis. Results of double filter-binding analysis at different ionic forces: 50, 150, 300 mM NaCl and 150 mM NaCl +dIdC. (i) TnpAIS608 binding to ds DNA; (ii) ssLE and (iii) ssRE substrates respectively. (iv) Corresponding Kd determined by Prism Graphpad software.

