Figure 5.
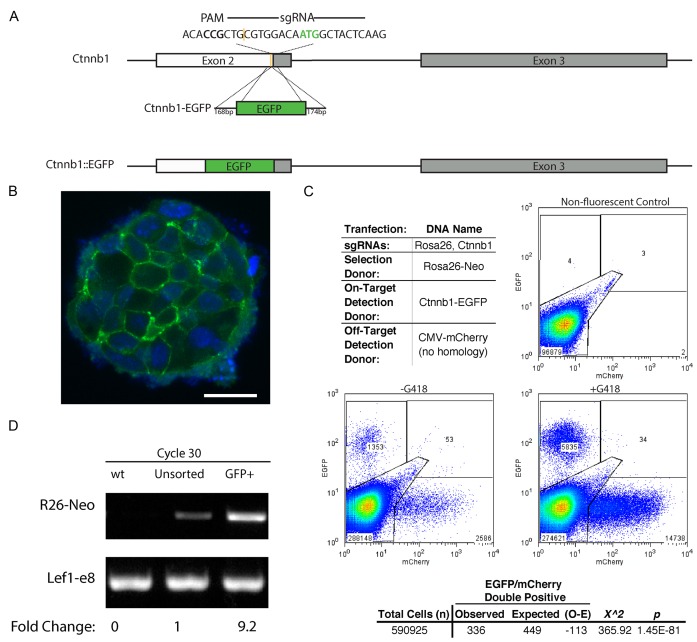
Segregation of on-target and off-target insertions among individual cells. (A) Schematic of mouse Ctnnb1 gene showing the sgRNA target sequence, the PAM site, the cut site (yellow) and the start codon (green ATG). Locations of exons 2 and 3 are noted by boxes. The size (bp) of homology arms and the Ctnnb1-EGFP donor with the in-frame EGFP insertion cassette are indicated. The expected result of editing is also indicated as the in-frame, Ctnnb1::EGFP allele. (B) A representative confocal image of colonies from GFP+ sorted, Ctnnb1-EGFP cells from the –G418 sample in (C). The nuclei are counterstained with DAPI. White scale bar represents 20 μm. (C) Representative flow cytometry dot plots using Ctnnb1-EGFP as the on-target detection donor DNA, CMV-mCherry (no homology) as the off-target detection donor, and Rosa26-Neo as the donor DNA for selection. Gates were drawn based on the non-fluorescent control. A Pearson chi square test was performed on the sum of events recorded for +G418 replicates. The expected was calculated as the frequency of mCherry+ events in the total population multiplied by the total EGFP+ events. (D) Semi-quantitative PCR analysis of COIN for on target Rosa26::Neo insertion (R26-Neo) was performed to confirm that coincidental insertion after selection for on-target insertion increases detection of on-target integrations. Product was amplified by an external primer specific to the gene locus outside of the homology arms and an internal primer specific to the insert. Lef1-e8 PCR product is a loading control for the PCR amplification. Densitometry of the PCR products is used to compare the relative frequency of integration in a population of cells before and after sorting for GFP+, Ctnnb1::EGFP cells. Reactions for cycles 22–28 are shown in Supplementary Figure S5.

