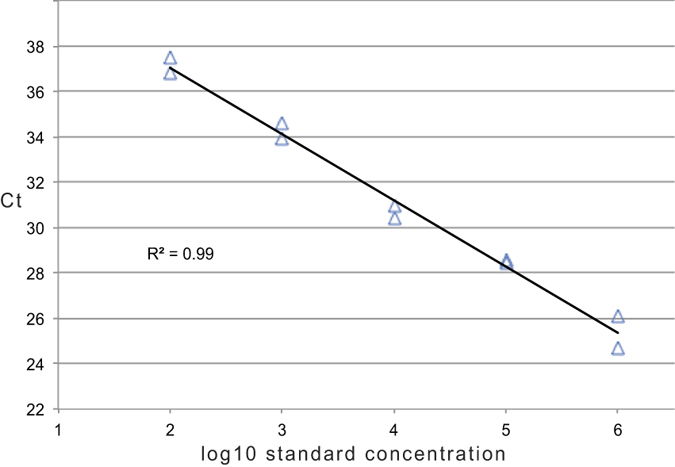
Figure 4. RNA Standard Curve.

Log10 serial dilutions of DNase-treated 108 RNA standard, tested in duplicate. Threshold cycle (Ct) values are plotted against the number of RNA copies/reaction.

Log10 serial dilutions of DNase-treated 108 RNA standard, tested in duplicate. Threshold cycle (Ct) values are plotted against the number of RNA copies/reaction.