Figure 2.

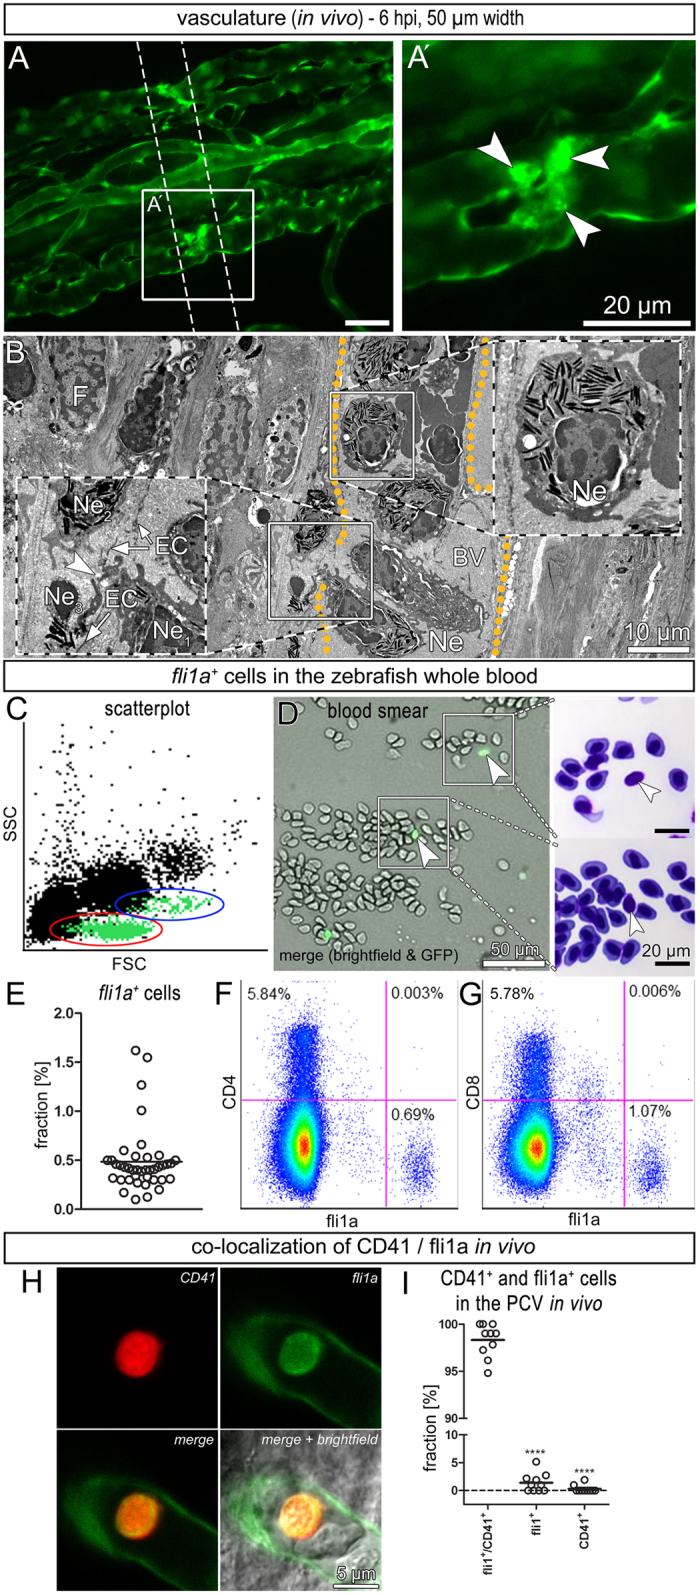
Early cellular response: local adhesion of neutrophils and thrombocytes (A,A’) Stereomicroscopic image showing that fli1a+ blood cells adhered to the venous wall inside the beam path (white arrowheads) in vivo. (B) Electron micrograph depicting an accumulation of neutrophil (Ne). (C) Scatter plot of peripheral blood with back-gated fli1a+ cells (green) clustering in two distinct populations. Red = lymphocytes and thrombocytes, blue = precursor cells. (D) Blood smear of untreated zebrafish whole blood. Fli1a+ cells were identified by fluorescence microscopy and relocated after staining with Giemsa-May Grünwald. (E) Fraction of fli1a+ cells in the whole blood (n = 40 [number of animals]). (F,G) Pseudo-color plots showing the absence of fli1a-expression in CD4+ and CD8+ leukocytes. (H) Example of a thrombocyte expressing CD41 and fli1a in 5 dpf old fish in vivo. (I) Fraction of CD41 and fli1a expressing blood cells in the posterior caudal vein in vivo (n = 10 [number of animals]).
