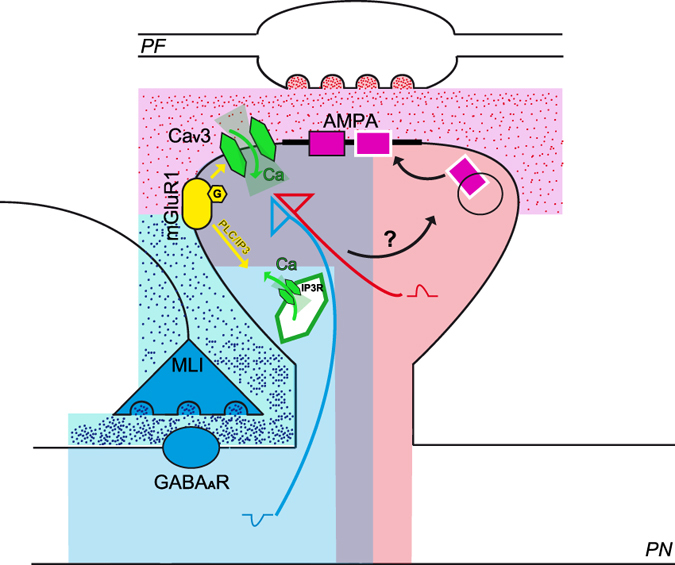
Figure 5. MLIdep-LTP model.

Schematic representation of the parallel fiber (PF) to Purkinje neuron (PN) synapse with a PF varicosity drawn in the upper part and the corresponding PN spine shown below. Molecular layer interneuron inhibitory synapse (MLI) is also shown in the scheme. Following high frequency parallel fibers (PF) stimulation, GABAA-mediated hyperpolarization (blue shadow) limits AMPA-induced depolarization (pink shadow) to a range suitable for CaV3 activation (light violet shadow). AMPA-mediated depolarization (red arrow) activates CaV3 calcium channels dependently on their availability regulated by inhibition (blue arrow) and CaV3-mediated calcium influx is enhanced by mGluR1 activation (yellow arrow). mGluR1 activation also leads to calcium release from intracellular stores via IP3 receptors. The described molecular steps initiate the cascade that leads to MLIdep-LTP and downstream events are still to be determined.
