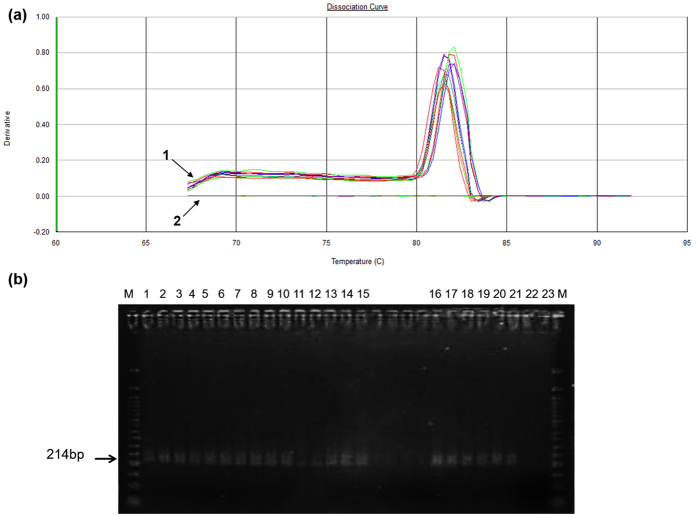
Figure 4. Analysis of the presence of GFP transgene in transfected embryos.
(a) Real time PCR detection of GFP sequences in the transfected embryos. 1. The melting curve for reactions each characterizing the expression of GFP gene. The curve contains only one peak indicating that the reaction generates only one product. 2. Non-tranfected embryo or control without template. (b) Gel agarose analysis of the presence of GFP transgene transfected embryo. PCR products were fractionated in 2% agarose gel. Screening for the transgene was performed by PCR encompassing 214 bp. “M” shows the molecular weight markers (50 bp). Lanes 1–15 contains the product from the PCR using as template transfected embryos with pDNA-MWNT (1:20 relation). Lanes 16–18 contains the product from the PCR using as template transfected embryos with pDNA-MWNT (1:10 relation). Lanes 19–21 contains the product from the PCR using as template transfected embryos with pDNA-MWNT (1:1 relation), Lane 22 represent non-tranfected embryo, Lane 23 represents a control without template.

