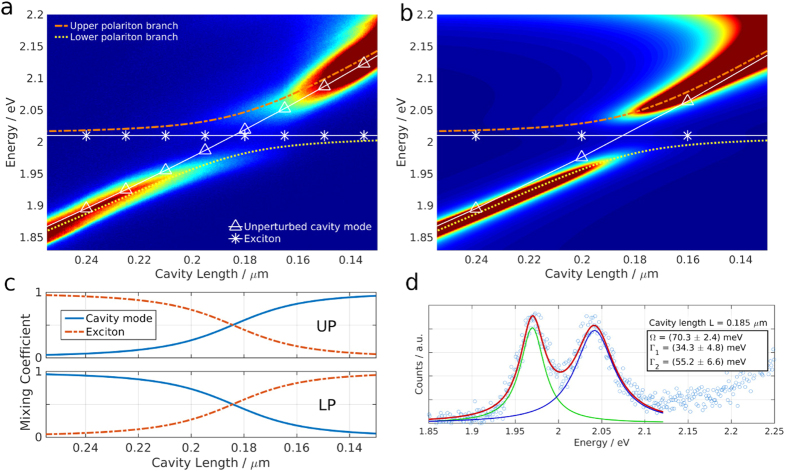
Figure 2. Polariton dispersion at room temperature.
(a) Transmission spectra as the cavity length is swept, showing typical polariton dispersion. The white continuous lines show the energy of the unperturbed cavity mode (triangles) and the exciton (stars). The energy of the coupled system, the two polariton branches are shown with the coloured, dashed lines. (b) Transmission spectra as cavity length is swept obtained by transfer matrix modelling. The dispersion lines from (a) are overlaid. (c) Photonic and excitonic fractions of upper (UP) and lower (LP) polariton branch. (d) Transmission spectrum at maximal photon-exciton mixing revealing a Rabi Splitting of ΩRabi = 70 meV.

