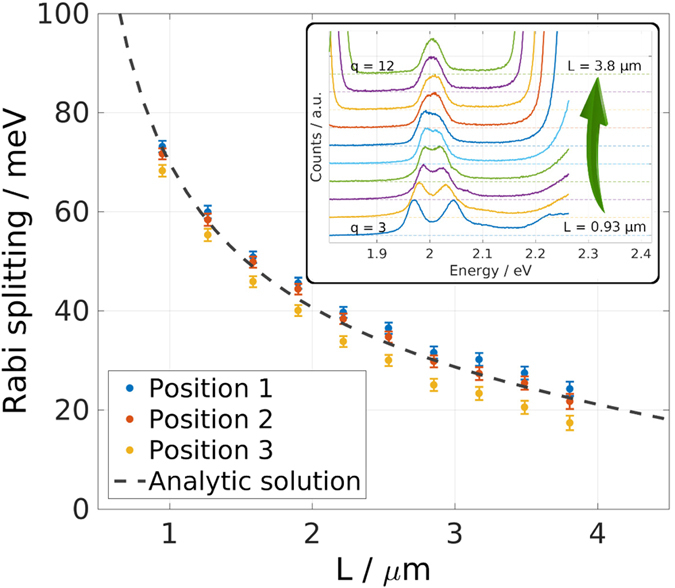
Figure 3. Varying the Rabi splitting.

Rabi Splitting for different longitudinal cavity modes (q = 3, ..., 12). Symbols show experimentally obtained values for three different positions on the WS2 flake with corresponding uncertainty. The dashed line corresponds to the analytic expression shown in Eq. 3, derived in the Suppl. Materials. The inset depicts transmission spectra for the different longitudinal mode indices stacked vertically for better visualisation.
