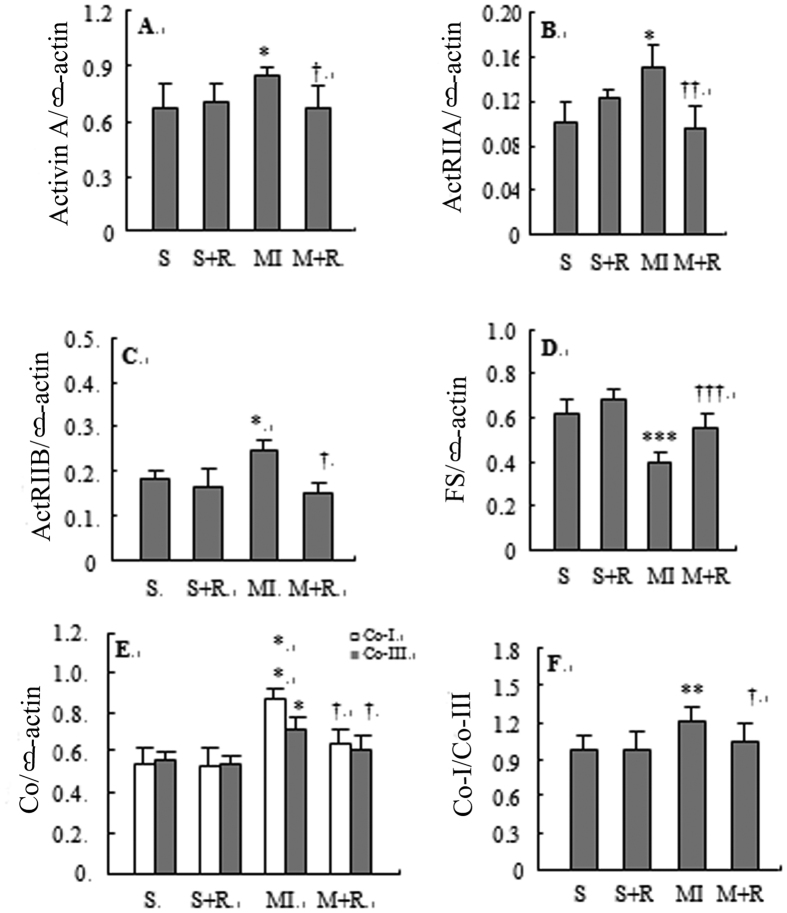
Figure 2.
Expression of activin A (panel A), ActRIIA (panel B), ActRIIB (panel C), follistatin (panel D), collagen I and collagen III mRNA (panel E), and the ratio of col I to col III (panel F) in the non-infarcted area of the left ventricle detected by semi-quantitative reverse transcription polymerase chain reaction. S represented SO group, S + R represented SO-ramipril, MI represented MI-model, M + R represented MI-ramipril. The depicted data are the means ± SD. *P < 0.05, **P < 0.01, ***P < 0.001 vs S; †P < 0.05, ††P < 0.01, †††P < 0.001vs MI.

