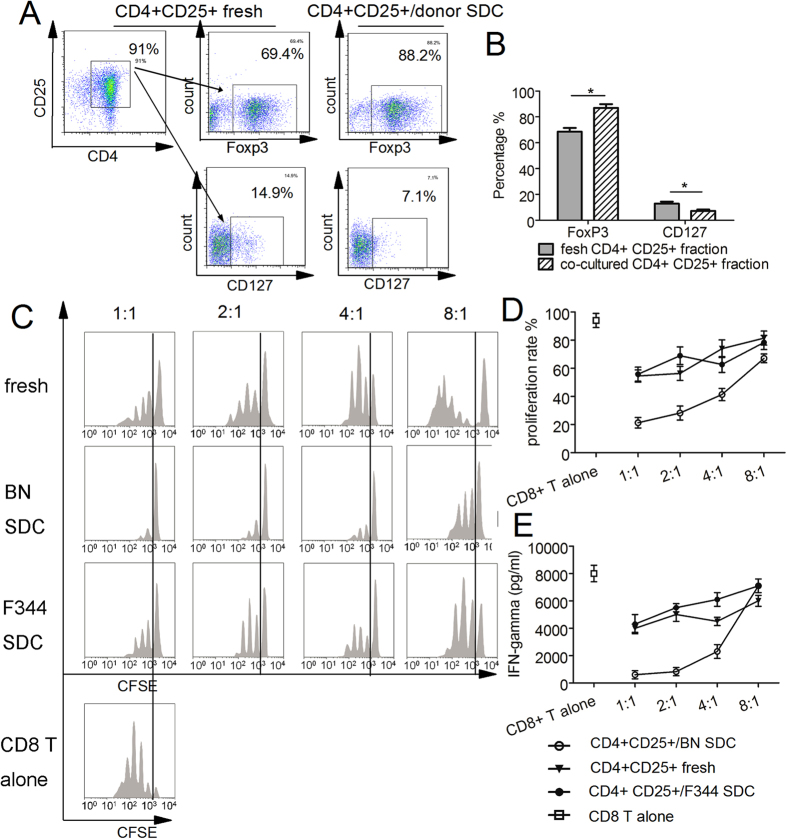
Figure 2. Obtaining and identifying donor antigen-specific Tregs.
(A) Both fresh isolated CD4+ CD25+ T cells and donor SDC co-cultured CD4+ CD25+ T cells were analysed by FCM. (B) The FOXP3 and CD127 expression rates in the two fractions of CD4+ CD25+ T cells were analyzed. (C,D) Graded numbers of pre-activated CD4+ CD25+ cells or fresh CD4+ CD25+ T cells were added to CFSE-labelled CD8a+ T cells as described in the Methods (n = 3 at each ratio). (C) CFSE was assessed by FCM, and (D) the proliferation rate was analysed. (E) IFN-γ was measured from the culture supernatants of the mixed culture system. One representative of three independent experiments is shown in (A/C). *Indicates p < 0.05.

