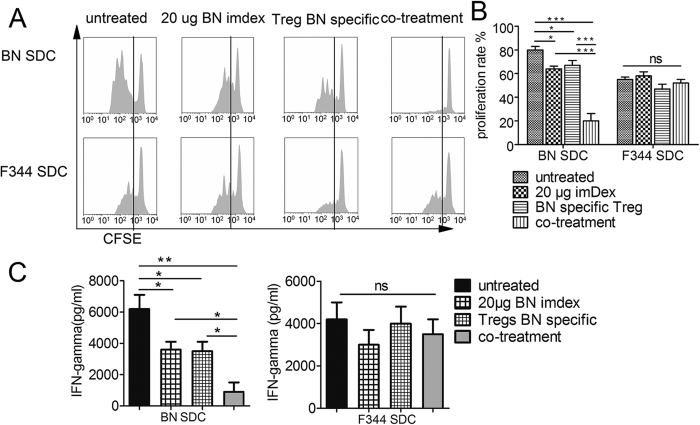
Figure 5. Analysis of the anti-donor cell response in recipients.
As described in Methods, ten days after transplantation, 5 × 10⁴ T cells purified from recipient splenocytes (from untreated recipients, 20 μg imDex treated recipients, BN-specific Tregs treated recipients or imDex/Tregs co-treated recipients; n = 3 in each group) were labelled with CFSE and incubated with equal numbers of irradiated SDCs (BN/F344 derived). (A) On day 5, CFSE intensity was measured and (B) the percentages of divided T cells were analysed. (C) IFN-γ was measured from culture supernatants on day 5, as described in the Methods. *Indicates p < 0.05; **indicates p < 0.01; ***indicates p < 0.001; ns indicates no significant difference.

