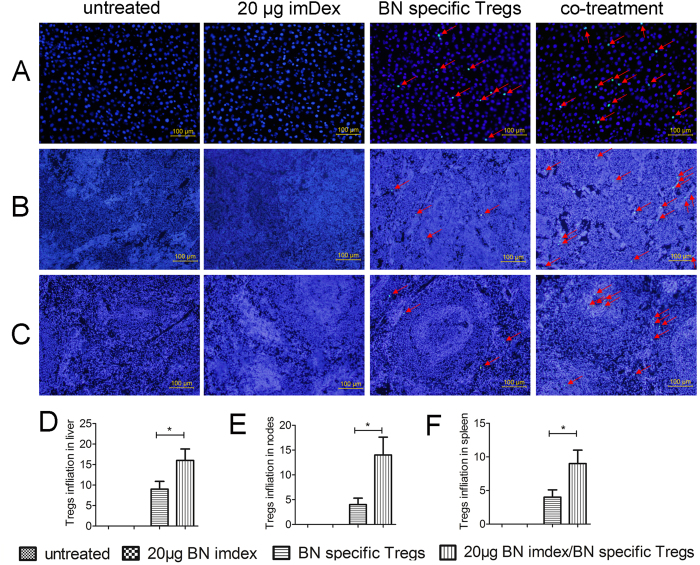
Figure 6. Immunofluorescence of liver grafts, mesenteric lymph nodes and spleens (magnification: ×200).
Additional 12 recipients accepted no treatment, 20 μg imDex, BN-specific Tregs or imDex/Tregs co-treatment and each group contained 3 recipients. Samples were harvested 10 d after transplantation, for immunofluorescence. CFSE-labelled Tregs (green) were stained with DAPI (blue) and merged into cyan. Nuclei of parenchymal cells were stained blue with DAPI. The average number of positive cells was analysed in 8 random fields per slide (×200, 2 slides per animal, 3 animals per group, 10 days after transplantation). Bars represent 100 μm. (A) Liver grafts. (B) Mesenteric lymph nodes. (C) Spleen (one representative field is presented). (D–F) Analysis of the average number of CFSE-labelled Tregs in (D) liver grafts, (E) mesenteric lymph nodes and (F) spleens. One representative field of 48 random ×200 fields per group is shown. *Indicates p < 0.05.

