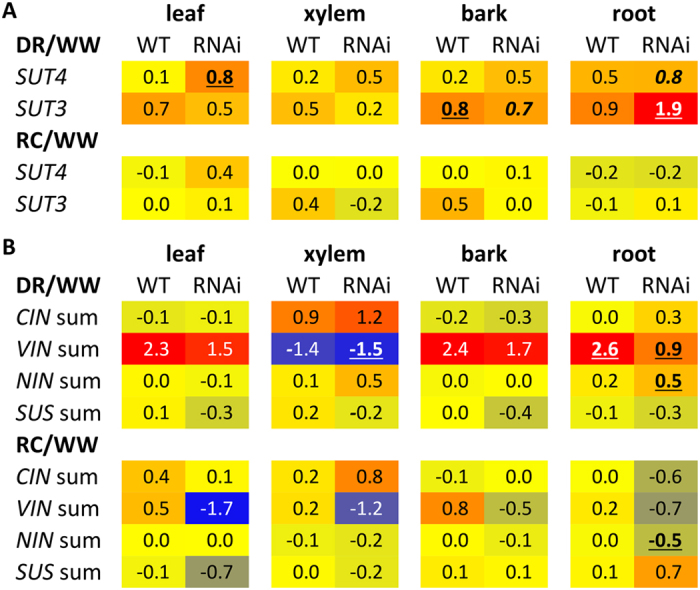
Figure 1. SUT transcript levels oscillated during the treatment cycle.

Heatmap illustration of DR and RC effects on transcript abundance of (A) PtaSUT4 and PtaSUT3, and (B) sucrose cleaving enzymes in various organs of wild-type and RNAi transgenic plants. Values represent log2-transformed FPKM ratios (DR/WW or RC/WW). Significant treatment effects on transcript abundance (FPKM) in (A) are denoted by bold-underline (Q ≤ 0.05) or bold-italics (P ≤ 0.05). In (B), FPKM values of individual cell wall (CIN), vacuolar (VIN), and cytosolic (NIN) invertase and sucrose synthase (SUS) gene models were summed for each biological replicate before the response ratios and statistical significance were determined. Significant treatment effects on FPKM sums are denoted by bold-underline based on the two-sample t test (n = 3 biological replicates).
