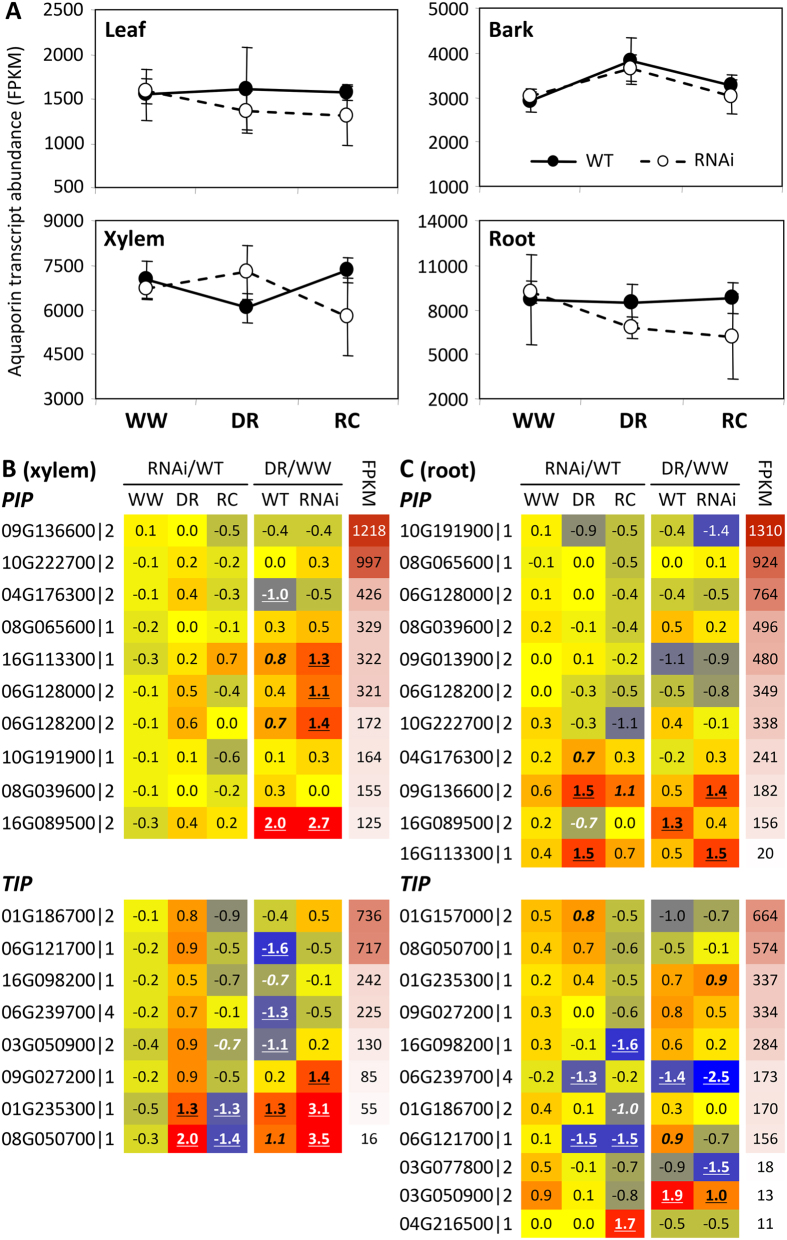
Figure 3. SUT4-RNAi affected drought response trajectories of aquaporin (AQP) genes.
(A) Illustrative depiction of total AQP expression trends. Data are means ± SD of n = 3 biological replicates, each representing the summed FPKM values of all individual PIP and TIP gene models. (B,C) Heatmap depiction of RNAi and DR effects on xylem (B) and root (C) transcript abundance. Values are log2-transformed response ratios of PIP and TIP transcript abundance. Genes are arranged by their transcript abundance (average FPKM) in each organ. Gene model names of P. trichocarpa genome v3 are abbreviated (i.e., 09G136600 for Potri.009G136600), followed by PIP (PIP1/2) or TIP (TIP1/2/4) subfamily designation. Significant treatment or transgenic effects are denoted by bold-underlined (Q ≤ 0.05) or bold-italics (P ≤ 0.05).

